


Severe convective storms (SCSs) have emerged as the secondary peril with the most significant financial impact on the insurance industry, posing unprecedented challenges for actuaries developing adequate and well-segmented homeowners’ insurance rates. Research presented at the Casualty Actuarial Society’s 2025 Spring Meeting in Toronto reveals a concerning trend of increasing frequency and severity of these weather events.
The presentation by Julia Hornack, MBA, and Jeff Schmidt, ARe, CSCR, summarized a recently released CAS Research Paper entitled “Developing Rates for the Severe Convective Storm Peril in Property Insurance.” The paper was co-authored by Julia Hornack, Jeffrey Schmidt, and Vadim Filimonov, FCAS, MS, all of Guy Carpenter. Schmidt opened the presentation with a recap of the historical SCS experience, followed by Hornack covering four ratemaking methodologies.
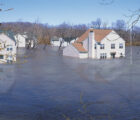
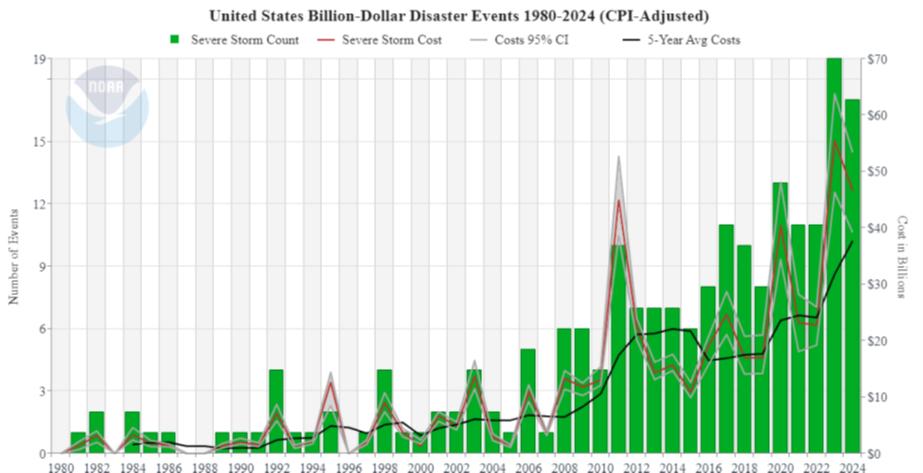
Per the National Oceanic and Atmospheric Administration (NOAA), 2024 recorded the second-highest number of billion-dollar SCS events in history, resulting in approximately $47 billion in insured losses. Perhaps more troubling is the consistent increase in “kitten” events — smaller storms causing less than $2.5 billion in losses that insurers are increasingly retaining rather than transferring to reinsurance. Schmidt explained, “As primary carriers retain more of these escalating high-frequency, low-severity events, accurate pricing becomes even more critical for maintaining insurer’s solvency.”
SCS catastrophe models, like hurricane and earthquake models, include three fundamental modules:
- Hazard module generates the site intensity, defined as the pattern of physical disturbance from an event (for example, hail swath, tornado path, etc.).
- Vulnerability module generates the damageability of the property, defined as how structural damage varies with exposure to differing levels of hazard (such as ground motion or wind speed).
- Financial module generates the loss calculation, estimating insured losses given structural values as well as the applicable insurance and reinsurance structures.
 Despite their strengths, SCS catastrophe models also have myriad limitations. Schmidt recapped a quick list of six before diving into deeper challenges:
- Population Bias — More events reported with population growth and better observation tools with time.
- Hazard Gradients — Damage can vary greatly from street to street in the same event.
- Damage Modes — Variances between hail, tornado, and straight-line winds.
- Urban Expansion — More homes and businesses at risk in growing metropolitan markets when SCS events occur.
- Frequency and Severity — Shift from traditional Tornado Alley south and eastward.
- Changing Baseline — Global average temperatures rising dramatically since the 1970s.
Per Guy Carpenter’s research, the data used by industry-leading SCS catastrophe models to calibrate their event sets only run through the 2010s, after which SCS events have escalated to new records. Schmidt explained, “New SCS catastrophe models scheduled for release in 2025 will help, but gaps will always exist between current climate risk and the latest model calibrations.” Thus why Guy Carpenter has developed a proprietary Severe Thunderstorm Risk Magnitude Index for the continental U.S.

Hornack then transitioned to summarize Guy Carpenter’s research of SCS ratemaking methodologies based on their review of historical rate filings. They distilled the menu down to four methodologies actuaries can employ to develop more accurate rates for perils impacted by SCS.
- Catastrophe adjustment factors: Applying factors to noncatastrophe projected loss costs based on historical catastrophe-to-noncatastrophe loss ratios.
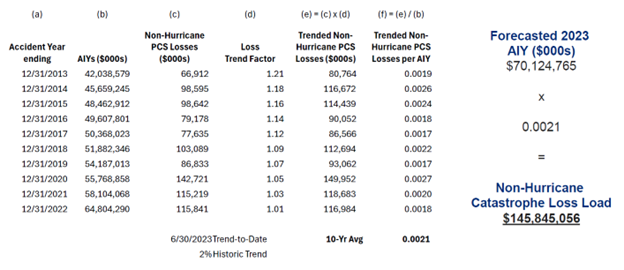
- Catastrophe losses to amount of insurance years: Analyzing catastrophe losses relative to insured value exposure over time, with appropriate trend factors applied.
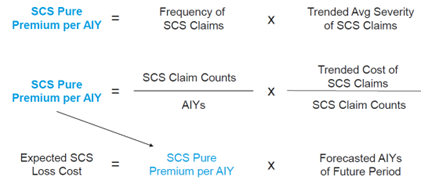
- SCS pure premium analysis: Breaking down SCS losses into frequency and severity components to allow for more targeted adjustments based on changing patterns in each component.
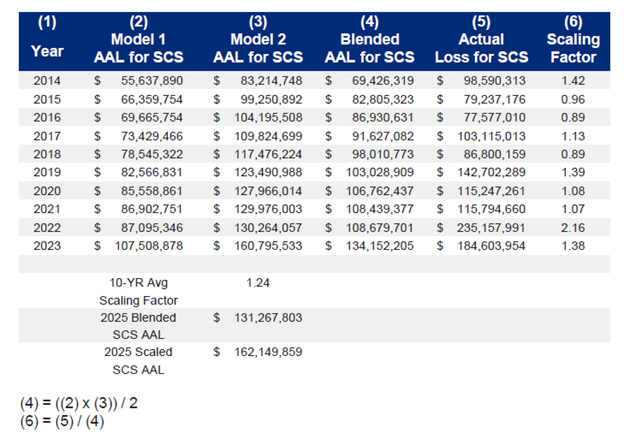
- Scaled catastrophe model outputs: Using catastrophe model annual average loss estimates but scaling them based on observed differences between modeled and actual losses.
Method #1 was commonly used when I started in the industry during the early 1990s. This method is considered the easiest because it only requires internal company loss data; however, it is not responsive to a long list of changes across time: geographic distribution of exposures, vulnerability of the building stock, and coverage changes. When hurricane and earthquake models were adopted, this became the default approach for all other catastrophe perils.
Method #2 became common in the 1990s to overcome some of the limitations of Method #1. Using “Amount of Insurance Years” (sum of total insured value in a time period) allowed the method to reflect the increasing value of the building stock. The incorporation of loss trend allowed the method to reflect other factors impacting losses that arise over time.
Per Guy Carpenter, Method #3 was not commonly used due to the high volume of historical SCS loss data necessary to estimate credible frequency and severity metrics by geography. They only found this method used in filings by larger carriers.
When SCS catastrophes models developed to maturity, Method #4 became an industry standard. Carriers may have initially relied on the models without calibration because they provided valuable differentiation between properties and geographies. However, calibration became the norm when carriers back-tested the models against their own loss experience. Calibration allowed carriers to leverage the prospective segmentation of cat models without underestimating overall SCS losses to achieve more adequate rates.
Hornack emphasized that no single method is ideal. Instead, they recommended combining approaches while ensuring thorough data collection and component analysis. Guy Carpenter’s research found a 4.6% variance between expected and actual losses over time (1990–2023), suggesting insurers should consider incorporating this difference into their pricing models to remain financially resilient.
SCS risk continues to evolve from a wide range of influences, with climate change one component of the larger story. Academic and industry research will continue to produce new insights to deepen our understanding of SCS risk. And yet, no single ratemaking method is sufficient to ensure adequate pricing for this increasingly significant peril. Thus, pricing actuaries need to consider multiple methods that work well with the internal and external data their carriers can obtain.
Dale Porfilio, FCAS, MAAA, is seniordirector, head of personal and commercial lines business development for insurance consulting and technology at WTW, beginning July 14, 2025. He was formerly chief insurance officer at the Insurance Information Institute and president of the Insurance Research Council.