


Across the CAS community, there is a growing general awareness of bias and fairness in the context of property-casualty insurance. Beyond regulatory requirements, insurers may be interested in understanding model fairness out of concern for the quality of the customer and employee experience. However, many insurers have not yet operationalized bias considerations by integrating them into their predictive modeling frameworks. As regulators continue to draft and implement policy to address model bias, the need for robust internal processes and governance frameworks becomes increasingly important.
In this article, we will highlight our company’s experience with implementing bias and fairness considerations, including the development of governance, technical tools, qualitative guidance and formalized decision-making procedures. As a Canadian P&C insurer writing both personal and commercial property and auto lines, we customized our approach based on the regulatory environment, the types of business we write, our existing model development processes and the types of models most commonly used at our company. We hope that by sharing the high-level steps, other insurers can develop their own approaches tailored to their needs.
Developing and Documenting a Plan
Both model and data governance strategies benefit from the inclusion of bias considerations as they help to promote a consistent adoption of bias detection checks. Within our governance platform we created a model repository that allows us to track all models deployed at the company. This provided a foundation for us to introduce tailored bias assessments that can be directly linked to entries in the model repository. Actuaries and analytics practitioners can use these pre-built questionnaires to assess and document a bias detection plan specific to their predictive model(s) as part of their planning activities. This also serves as a point of control to ensure that analysts have done their due diligence.
The assessment developed at our company includes questions about the use case, such as identifying who is impacted by the model and whether the impact is potentially assistive or punitive.
The assessment developed at our company includes questions about the use case, such as identifying who is impacted by the model and whether the impact is potentially assistive or punitive. Following this, analysts delve into additional questions that cover topics such as:
- Determining the impact of regulation or legislation on predictor selection.
- Selecting the bias-detection tests that will be performed.
- Identifying groups for which bias tests will be performed.
- Developing methods for mitigating bias through human intervention.
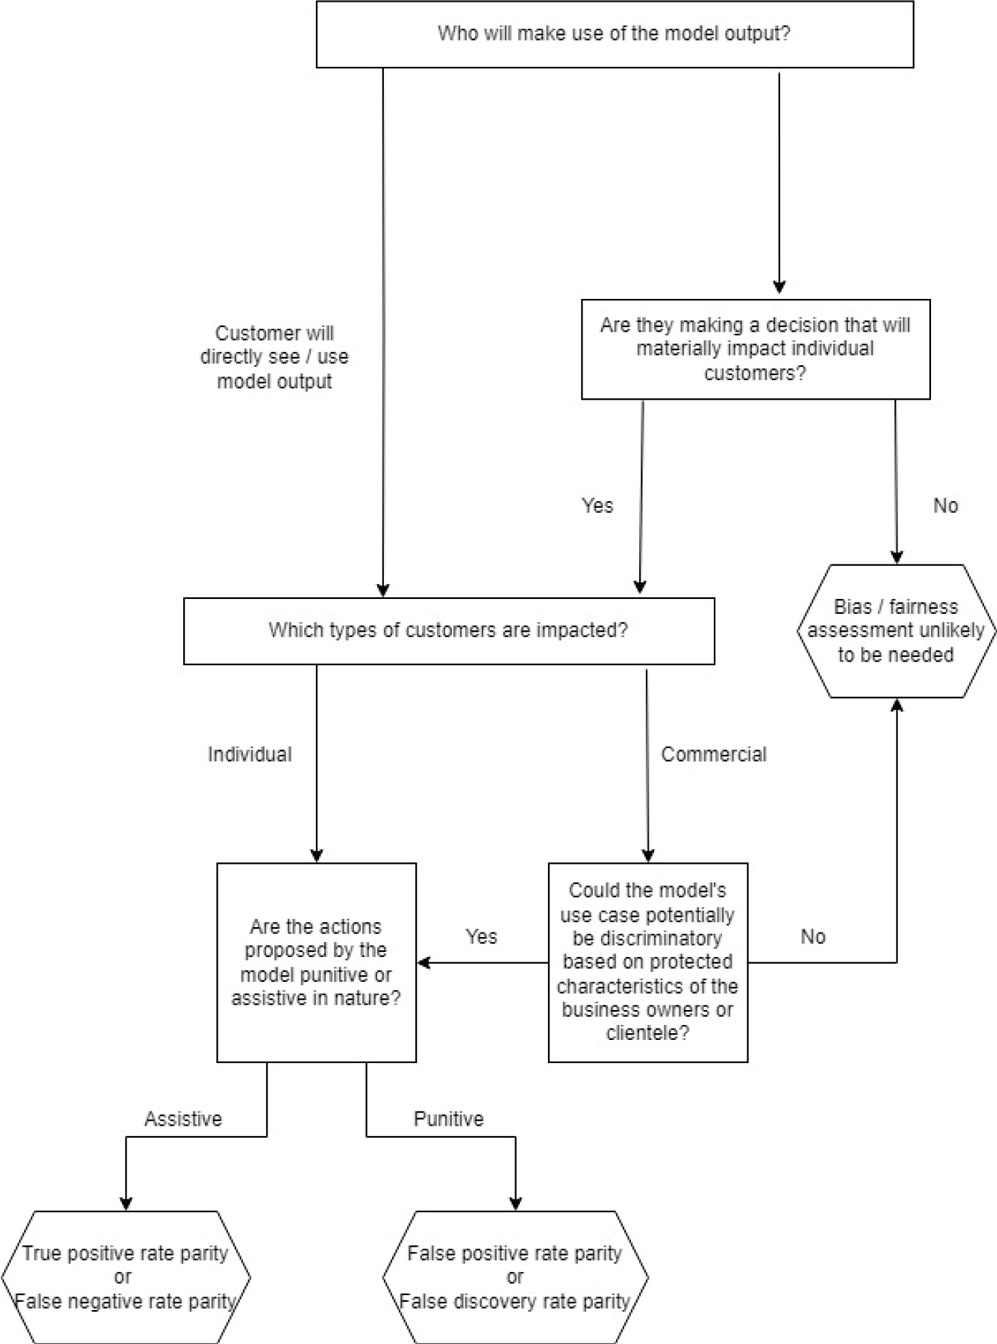
The questionnaire is accompanied by links to in-house guidance to ensure assessment responses are reasonable and consistent. This guidance includes a bias-detection metric decision flowchart to help determine which test(s) should be included in the analyses.[1] (See Figure 1.)
The bias detection “cookbook”
We wanted to ensure that our company’s analytics practitioners — who include both actuaries and non-actuaries — have the technical tools and knowledge needed to perform a model bias test. We started from publicly available sources, including “Methods for Quantifying Discriminatory Effects on Protected Classes in Insurance”[2] from the CAS Research Paper Series on Race and Insurance Pricing. This paper provides this criterion as the definition of “demographic parity” for a classification model: P(Ŷ = 1 | A = a) = P(Ŷ = 1 | A = b).
Figure 1. Bias-Detection Metric Decision Flowchart
Because a criterion defined by an equation doesn’t directly explain the steps to perform the test, we developed a “cookbook” containing verbal descriptions of the steps needed to perform the test (“recipes”) in general terms. This also provided an opportunity to standardize practices around how we would account for situations where data on protected class membership (“A” in this equation) is not available.
Following is an excerpt from our cookbook that outlines the recipe for the demographic parity criterion:
- Join census data on group membership by geographic unit.
- Calculate model prediction for each observation.
- Calculate average model prediction by geographic unit.
- Assess whether there is an increasing or decreasing pattern in the average model prediction as the census variable increases.
This made the approach more accessible to a broader audience than a mathematical equation, and the broad language used in the recipe makes it widely applicable — the second step, for example, can apply to a wider range of models than just classification models.
The tool-agnostic nature of the recipes enables analysts to implement the test in whichever tool they’re working with. One person might perform these steps in Excel, another in Python. An example of one of these tests is illustrated in Figure 2. We supplemented these cookbook recipes with a repository of code, implementing these tests in two of the most commonly used languages at our company, R and Python.
The need for qualitative guidance
Prior to joining the workforce, many actuaries and other data science practitioners complete post-secondary education in science, technology, engineering and mathematics (STEM) fields. While these programs provide actuaries with a strong understanding of bias from a statistical sense, many of today’s actuaries did not go through programs that included coverage of the impacts of systemic biases in predictive modeling. This may present a challenge to actuaries, who may lack the foundational understanding, skills and experience to identify situations where a pre-existing social bias can impact their predictive models. As such, there is a clear need for intentional education on this topic, to ensure that social biases that may be present in real-world data and algorithms are not further reinforced.
Feedback from end-users has played a crucial role in shaping the educational content we developed. The feedback received from project teams who implemented bias tests is that, while they understood the tests from a technical standpoint, they didn’t know which biases they should be testing for. Teams would tend to “over-test,” looking at numerous combinations of metrics and protected groups, without understanding the “why” behind the selections being made. We wanted them to narrow their focus to biases that we have a rational reason for suspecting could be present.
To address this, we developed a user guide that specifically identifies systemic biases that can impact predictive modeling in the context of the P&C insurance industry. This document synthesizes information pulled from the literature[3] and news media to create an overview of biases to be tested for, based on several considerations, such as:
- Situations in which human judgment can influence the response.
- Modeling use cases where known biases have been documented.
- Predictors whose quality may be impacted by systemic bias.
- Predictors that have historically acted as proxies for protected classes.
As an example, recent news reports[4] alleging racial discrimination in auto insurance availability suggest that we should be testing for racial bias in models used for underwriting risk selection. However, we also considered biases from other industries whose mechanisms could plausibly be impacting our models. For example, research on bias among medical professionals[5] suggests that we should be testing for bias in models used to support medical claims management.
The guide also serves as key reference material when analysts are completing their bias and fairness assessments, and it helps to further reinforce the importance of qualitative considerations when developing a predictive modeling plan. These assessments are submitted at the start of a project, and an independent reviewer provides feedback. This feedback loop provides a mechanism for analysts to build on their existing knowledge through reinforced, applied and tangible learning. It also provides a means for injecting diverse views into a process with considerable subjectivity.
Refining decision-making processes
In the example shown in Figure 2, the decision to use the new model would be easy: It is both more accurate and less biased than the old model. But this is not always the case — sometimes there is a need to decide between a more accurate model and a less-biased model. The model approver needs to exercise business judgment to determine which model to use, considering specifics of the use case.
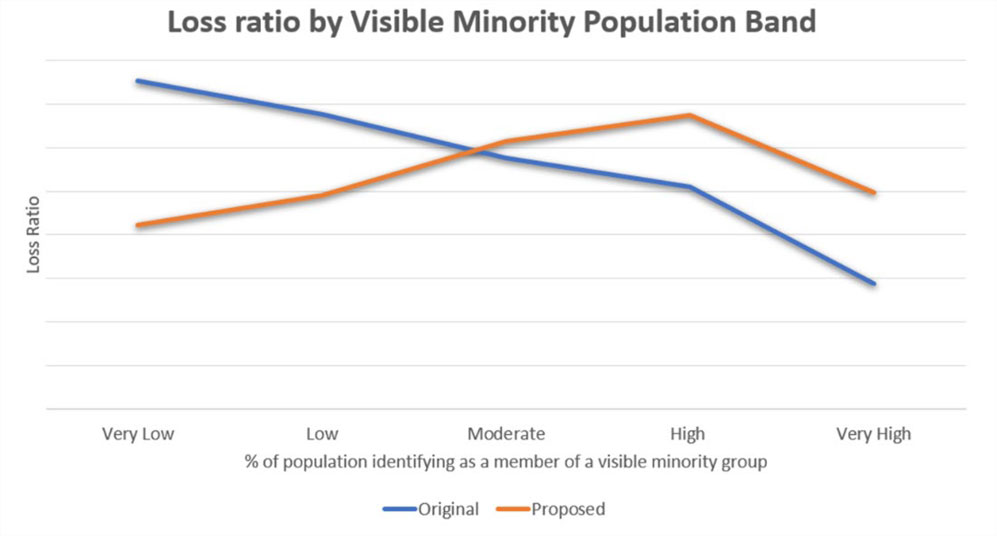
Sometimes there is a need to decide between a more accurate model and a less-biased model. The model approver needs to exercise business judgment to determine which model to use, considering specifics of the use case.
We developed internal decision-making processes to ensure, in situations where bias is a concern, that the decisions and reasons for them are clearly documented. These are described as a series of “escalation levels,” depending on the complexity of the questions related to bias, and for each level we answered questions such as:
- What metrics must the project team provide to support the decision, and how are they vetted?
- Who makes the decision on model usage, and who should they consult with?
- What information must be documented?
- What monitoring must be performed after the model is deployed?
Examples of escalation levels include:
- No bias concerns. (In this level, the focus is on confirming that a bias test has been done, reviewed and documented.)
- Decision between a more accurate model and a less-biased model.
- Decision between two models that exhibit different types of biases.
- Decision whether a model in which an otherwise-prohibited factor is used to mitigate the bias can be employed.
We tailored our answers to these questions based on the existing model development and approval processes at our company. More complex situations require more independence between individuals involved in the process. The process also specifies points at which the company’s legal team must be consulted, notably in situations in which there is ambiguity over whether a particular factor is permissible for use.
What’s next?
Our company started the journey to integrate bias considerations formally into our predictive modeling process two years ago, and this journey is still ongoing. It has been a continuous process of learning about how our project teams were, using the resources we provided, understanding what their questions were and adjusting our approach to meet their needs. We hope that by sharing some of the approaches we have used, other organizations will be able to accelerate their processes of operationalizing model bias checks by developing their versions of the tools that we have outlined here.
Craig Sloss, FCAS, FCIA, Ph.D., is a technical consultant and lead data scientist on the Advanced Analytics team at Definity Financial Corporation and is a member of the AR Working Group.
Elizabeth Bellefleur-MacCaul is senior advanced analytics professional on the Advanced Analytics team at Definity Financial Corporation.
[1] Our flowcharts are loosely inspired by the Aequitas “Fairness Tree” provided by the Center for Data Science and Public Policy at the University of Chicago: http://www.datasciencepublicpolicy.org/our-work/tools-guides/aequitas/.
[2] See https://www.casact.org/sites/default/files/2022-03/Research-Paper_Methods-for-Quantifying-Discriminatory-Effects.pdf?utm_source=Landing&utm_medium=Website&utm_campaign=RIP+Series
[3] Including two papers from the CAS Research Paper Series on Race and Insurance Pricing, “Approaches to Address Racial Bias in Financial Services: Lessons for the Insurance Industry” and “Understanding Potential Influences of Racial Bias on P&C Insurance: Four Rating Factors Explored.”
[4] See, for example: https://www.cbc.ca/news/canada/montreal/quebec-human-rights-commission-insurance-company-discrimination-indigenous-1.6639678.
[5] See, for example: https://www.ncbi.nlm.nih.gov/pmc/articles/PMC5333436/.