


Most of you are aware that the cost of homeowners insurance for many has substantially increased over the past two years. I happen to know something about this. Between 2016 and 2023, I worked as a homeowners pricing actuary at two different insurance companies. My sole purpose at each respective company was to ensure that homeowners rate levels were adequate, not excessive and not unfairly discriminatory — with adequacy being the most significant challenge in the current environment. To be even clearer on this point, my main responsibilities could be summarized as follows:
-
- Provide up-to-date state rate level indications and recommended rate increases for each of the upcoming state rate filings.
- Work with several other teams at each company to file and execute the agreed-upon pricing targets.
That said, I fully recognize that my team’s analysis, as well as analyses performed by other homeowners pricing actuaries scattered across the country, shoulders some of the responsibility for the large increases to homeowners insurance bills.
With all of this in mind, the purpose of this article is to succinctly share some of my observations and experiences over the past several years which will help to explain the large recent homeowners premium increases affecting many of us. I will support most assertions with data from publicly available rate filings, U.S. Bureau of Labor Statistics (BLS) and S&P Global. For what it’s worth, I will also offer up a few thoughts at the end regarding how I anticipate industry rate activity playing out over the next two years. With that in mind, let’s dive in!
Amount of insurance year (AIY) trend
On a countrywide level, one observation I can offer that generally applies across most states has to do with something called “Coverage A,” which is simply insurance jargon for the insured value of your home. In most years before 2021, many insurance companies automatically increased everyone’s Coverage A by roughly 2.5%-4% per year, commensurate with typical inflation in home values. Another bit of insurance jargon is called the “Coverage A inflation factor” or “AIY Trend.” This means that even if insurance companies left rates alone, homeowners premiums would automatically increase by roughly 2%-3% simply due to the limit of the policy increasing. That is not a typo — premiums do not increase linearly with Coverage A. A little over two years ago, many companies recognized higher levels of inflation and increased their Coverage A inflation factor to something between 7% and 10%. That means that over the past two years, roughly 5%-7% of the annual premium increases homeowners have experienced have been due to this larger than usual Coverage A factor. One can empirically validate or refute this assertion by reviewing premium and/or Amount of Insurance Year (AIY) trends of carrier filings submitted in SERFF20 over the past 12 months. Generally speaking, the main driver of homeowner premium trends is the Coverage A inflation. Table 1 shows premium and AIY trends for a few recent filings from large carriers with substantial market share.
As you can see, Allstate and State Farm reported recent Coverage A inflation of between 8.3% and 10.9%. Farmers and Safeco reported premium trends near 5%, which is quite a bit higher than a more typical 2%-3% longer-term premium trend.
In summary, over the past two years, homeowners are seeing their premiums go up by three additional percentage points over and above most years. This is due in substantial part to the regularly scheduled, but larger than typical, increases in Coverage A.
However, as most of us are all too keenly aware, our homeowners premiums have been increasing by substantially more than just the 5% to 7% due to the higher Coverage A inflation. Most of us have been experiencing abnormally large annual premium increases of over 15%. So, what else has been driving the recent large increases? To answer that, we’ll need to explore the rate at which losses have been increasing coupled with something known in the industry as “disruption management.”
Loss trend
Let’s start by reviewing the same random sampling of filings and see what different insurers are seeing in terms of recent loss trends.
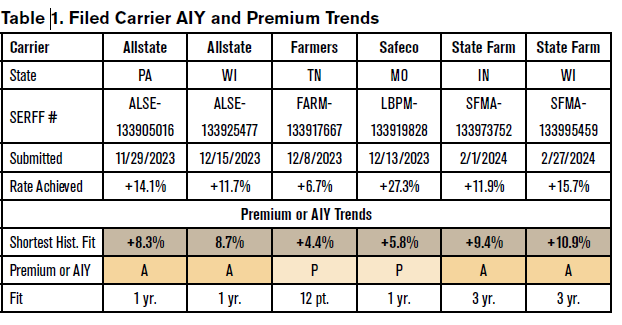
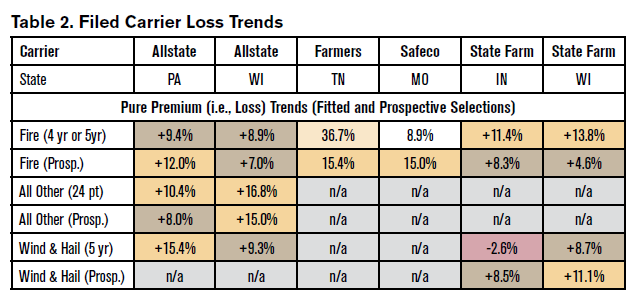
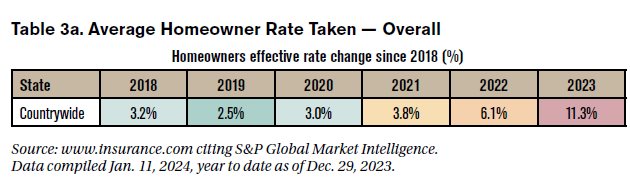
Table 3b. Average Homeowner Rate Taken — Top Carriers
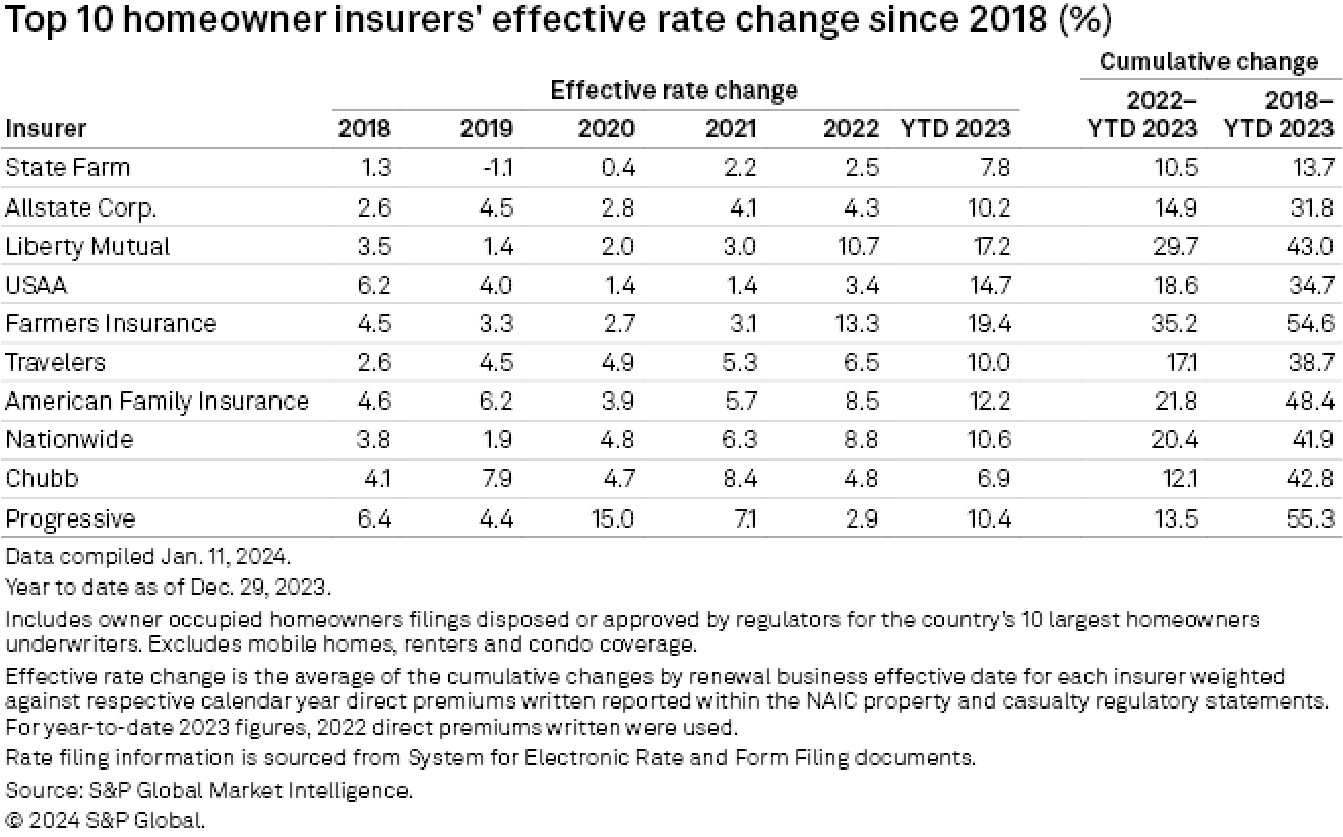
Table 2 shows that average historical and anticipated prospective annualized homeowner loss trends for the selected filings are all generally in the 7%-15% range. That means that losses have generally, year after year, been increasing at an average rate of roughly 10% over the past five years. Table 3a shows us that overall, homeowners rates climbed by roughly 3% per year between 2018 and 2020, and Table 3b shows us that homeowners rates at most individual carriers climbed between 2% and 5% per year between 2018 and 2020. With the exception of Progressive, homeowner rate activity only started to pick up several months after the start of COVID; we can see this with the increases in 2021 and 2022. Little by little, those ~3% pre-COVID rate increases were not keeping pace with the 7%-15% loss trends and the insurance industry appears to have realized that conditions had inflected, requiring them to take more than their customary approximately 3% annual increases in order to achieve adequacy. The industry had no choice but to rethink their long-held disruption management strategy.
Disruption management
So, what is “disruption management?” Managing disruption is a strategy that companies have in place to keep operations running smoothly when unforeseen situations emerge. As an example, for many (many, many) years, carriers generally attempted to take single-digit rate increases per year to avoid disrupting their book of business. Put more simply, carriers did not want to lose their existing customers. In general, insurers want to avoid double-digit rate increases whenever possible. So, if a carrier indicated a 30% rate need in a given state instead of requesting 15 or more points of rate, in many cases that carrier would elect to take rate increases just under 10% every year and hope that loss trends subsided over the subsequent five years so they would get to rate adequacy in about five years. One might be inclined to ask, “What’s so magical about 10%?”
Retention
Part of the reluctance towards taking larger indicated rate increases was driven by anticipated regulatory pushback or delay related to pursuing the indicated rate need. Several states have written or unwritten rules that limit how much rate they will approve in a given rate filing. Another very considerable part of the reluctance dealt with carriers’ wanting to retain as many of their existing customers as possible. That second point brings us to an extremely interesting and very relevant sidetrack: Retention! The Statement of Principles Regarding Property and Casualty Insurance Ratemaking does not mention retention as a consideration, and demand modeling has been a cause of significant consternation in recent years and decades — to the point where several states have explicitly forbidden “price optimization.” For clarity, I would like to make a distinction between portfolio level retention considerations and price optimization at the individual account level. In my experience, when making decisions regarding state-specific rate filings, the potential retention impact at the overall book level is a consideration, but the potential retention impact at the individual account level is not.
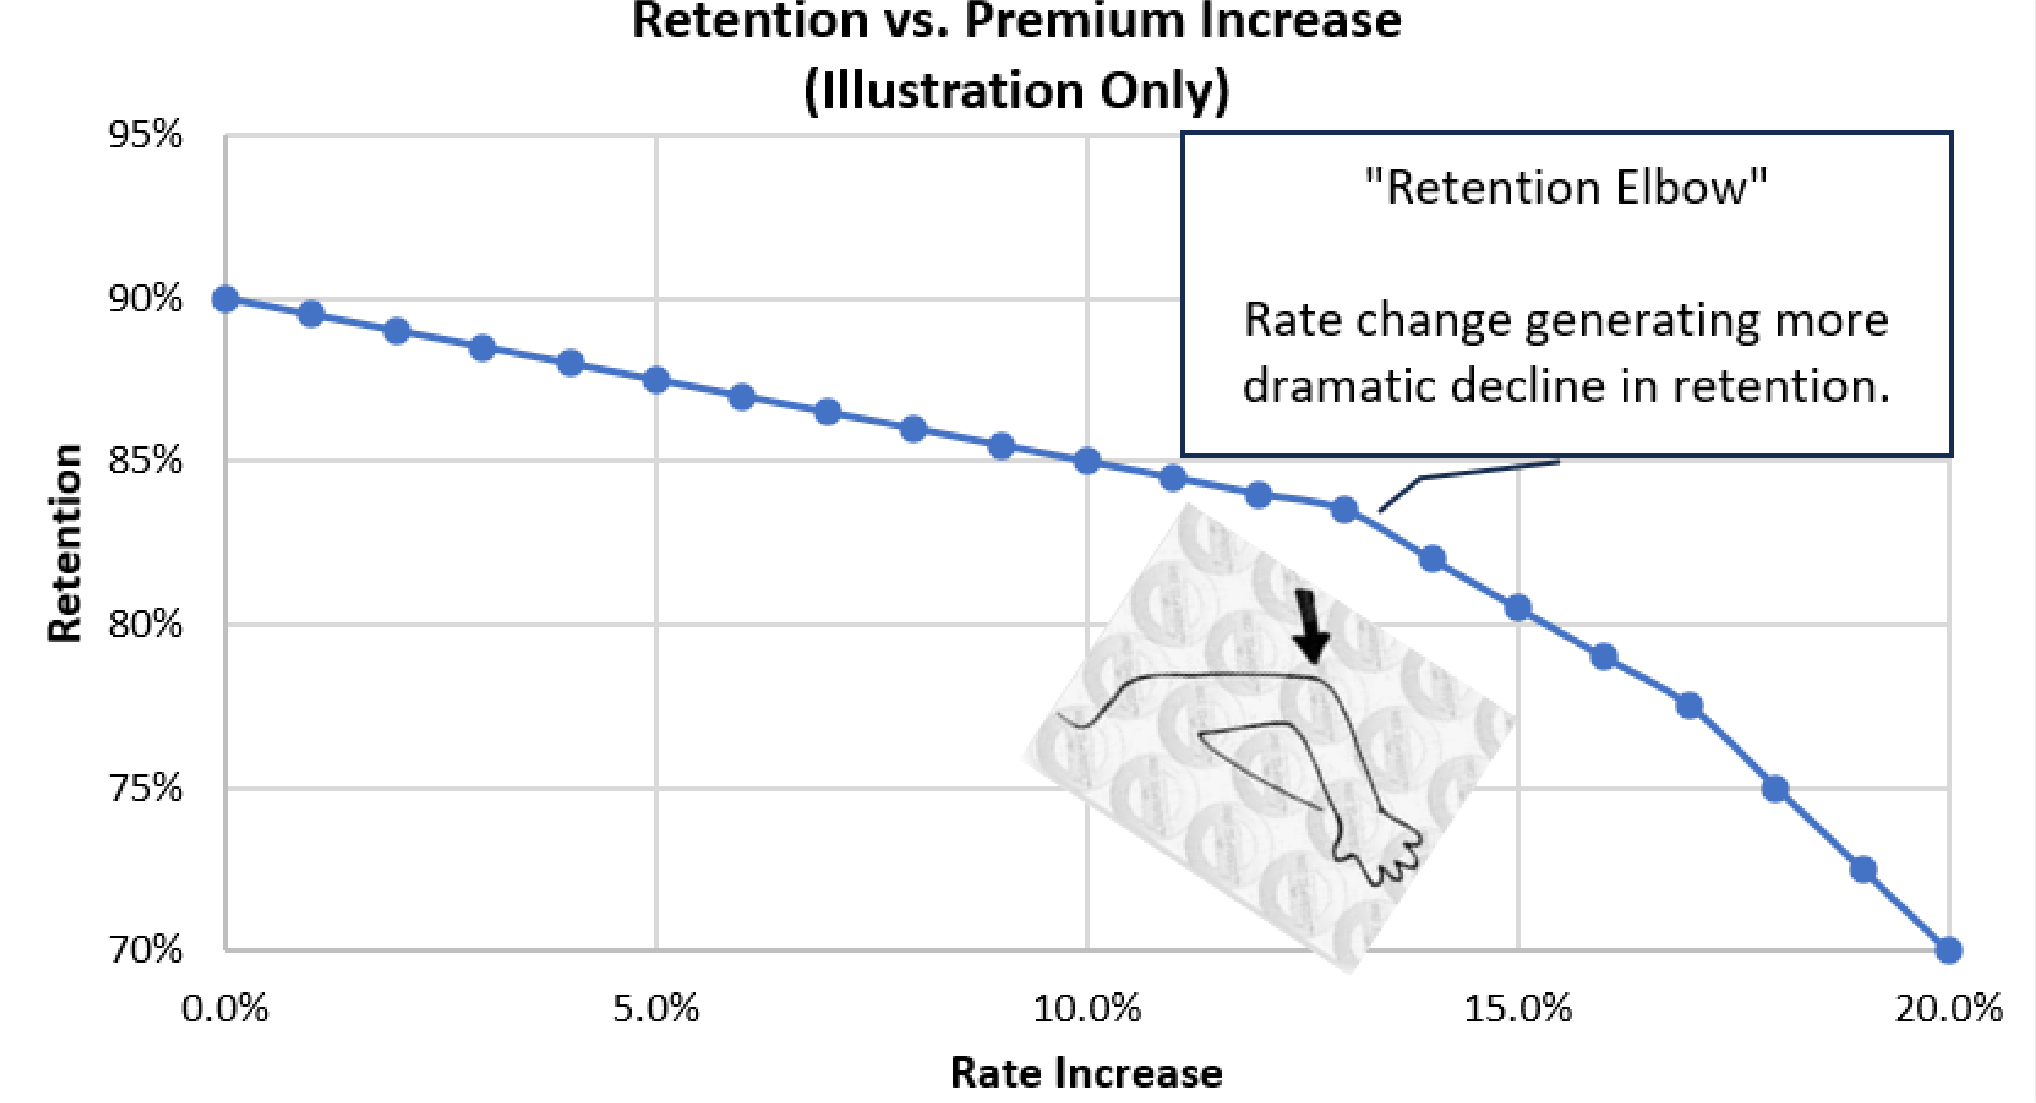
Retention is generally thought to not decline linearly with rate across the board. Customers may not tend to shop for another carrier if their rate change is in line with traditional levels of inflation. Simply put, inflation is generally a well and broadly understood concept and customers likely have a reasonable tolerance of price increases on any product including insurance, up to a certain point. There is not a consensus on what that precise inflection point is, but in a traditional inflationary environment single-digit rate increases were in many cases a prudent long-term retention strategy, regardless of ebbs and flows in the indication from year to year. The hypothetical chart (Figure 1) illustrates the general concept of how retention might behave in light of different rate increases in the not-too-distant past. There is debate as to the position and magnitude of the retention elbow, however, rate increases in excess of 10% were outside of the historical inflationary norms, and any insurers actually measuring (experiencing) the slope of the curve out to the far right likely were none too pleased with their retentions!
Back to the balance of stability versus responsiveness. Carriers abiding by the historical norm of consistently taking 3%-5% rate increases despite mounting evidence to the contrary reversed course roughly two to three years ago as the entire industry recognized the need to catch up to the true level of homeowners insurance costs. Based on Table 3b, Progressive appears to have been the first company to reach the realization that the 2010s inflationary environment was not coming back anytime soon and in the following 12–18 months, most of the industry appeared to follow suit and, in turn, many companies started taking relatively larger rate increases right around late 2021.
An extremely interesting aspect to this very unusual rate environment is that despite these large industrywide rate increases, retentions have remained significantly higher than expected. The prevailing wisdom is that retention isn’t necessarily a function of absolute rate, but rather of relative rate. In other words, when projecting the retention outcomes of rate selections, actuaries shouldn’t be measuring historical known retentions against the actual rate taken by their company, but rather against how much more or less rate their company took compared to the competitors and inflationary pressures at that point in time. Unfortunately, accurately measuring relative rate action is extraordinarily challenging. In any event, since the entire industry has been taking double-digit rate increases, the retention elbow appears to have drifted much further to the right since a 10% rate increase today “ain’t what it used to be.”
Figure 1.
Drivers of increased costs
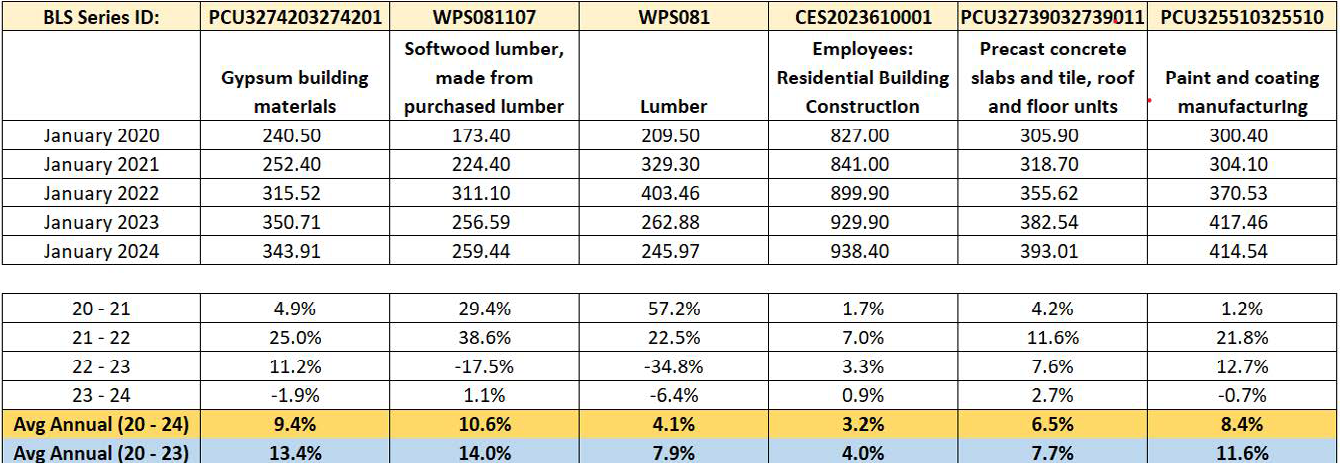
What exactly is driving the increased costs? To answer that key question, one can review publicly available pricing data on bls.gov to get a sense as to the key drivers. The table below summarizes several key trends from a few pertinent data sets.
Regarding the pricing statistics shown in Table 4, we offer the following observations.
- The price of all building materials reviewed skyrocketed after March 2020. The largest year-over-year trend numbers are in the 20–21 and 21–22 rows. We all would have guessed that prices increased the most right after COVID and the pricing data available from BLS clearly supports that hypothesis.
- Excluding lumber, everything measured had three consecutive years of price increases.
- Gypsum had average annual increases of over 13%.
- Raw materials for roofs and floors had average annual increases of over 7%.
- Paint had average annual increases of over 11%.
- Lumber absolutely skyrocketed between January 2020 and January 2022 but recovered slightly during 2022. Those very large lumber prices in 2020 and 2021 would have adversely impacted insurance losses in those two years.
- The last row (23-24) shows minimal year-over-year increases in the measured commodities. Should we dare be so optimistic as to believe the worst of the inflation monster is behind us?
So where does all of this leave us?
Table 4. Pricing Trends of Home Building Supplies
Underwriting experience
We have heard much of this before — everything became much more expensive right after COVID. What we all really want to know is when will the large premium increases come to an end (or at least settle down to the good old days of low- to mid-single-digit increases)? Excellent question! To answer that, we’ll first need to take a quick peek at some industry-wide combined ratios to see exactly how inadequately priced the industry has been. As a quick level set, a combined ratio is the ratio of loss and expense as a ratio to earned premium. A 108% combined ratio means an insurance company paid out $108 in losses and expenses on every $100 of premium they earned during the year.
We can see from Table 5a that industrywide net written premiums increased by approximately 10% between 2021 and 2022 and then are projected to increase by approximately an additional 12% between 2022 and 2023. In Table 5b we see that 2022 and 2023 had combined ratios of 104.4% and 110.9%, respectively. We can also see that writing homeowner insurance has been unprofitable in six of the past seven years! What meaningful information can we glean from these tables?
Table 5a. Homeowners Combined Ratios and Net Written Premiums

Table 5b. Auto and Homeowners Combined Ratios (updated)
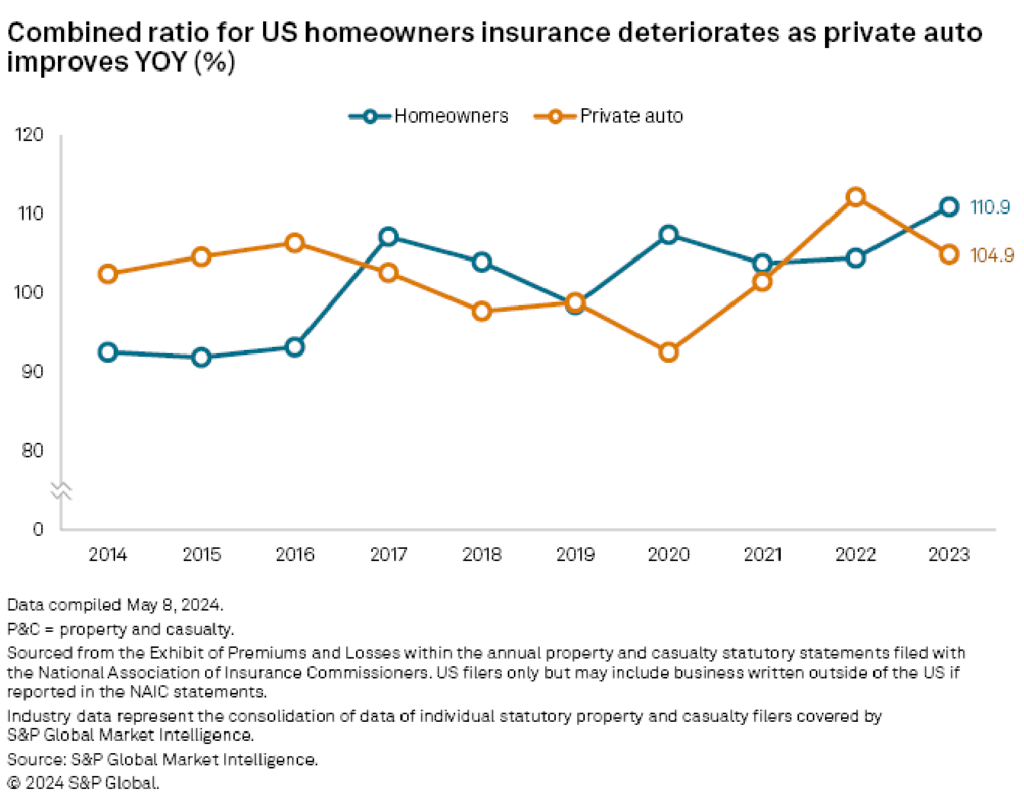
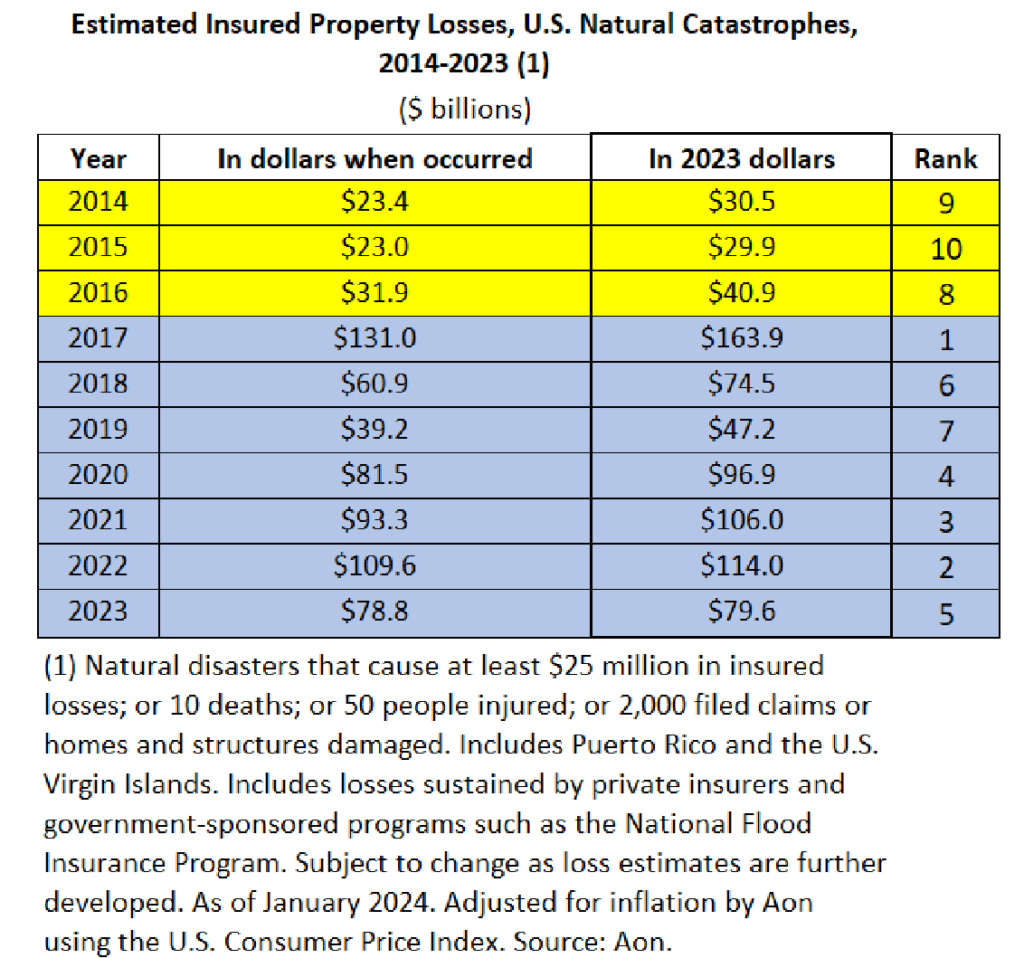
Table 6. Homeowners Catastrophe Losses by Year
Connecting the dots between Tables 3a and 5b, the industry was only taking three points of rate each year between 2018 and 2020, which was nowhere near enough to make a meaningful dent on the over 100% combined ratios. With such horrible results, why was the industry only taking three points of rate? We have already mentioned the disruption management part of the answer. Another meaningful part of the answer is that the industry did not want to overreact to recent worse-than-average catastrophe experience. Estimating a fair, reasonable and adequate catastrophe loss provision is a major component of the rate level decision-making process. In the homeowners line of business, this particular pricing component is especially challenging to estimate. Let’s explore this a bit further.
In Table 6, we show the annual catastrophe losses impacting the homeowner insurance industry. Imagine that you are a pricing actuary in January 2020 and you see the catastrophe losses between 2014 and 2019. When setting rates, you might make a catastrophe provision assuming $55 billion–$60 billion would be an adequate provision. You might be thinking that $35 billion–$40 billion is a typical catastrophe year, but you need to account for outlier years like 2017, so you add a cushion to your catastrophe provision and call it $60 billion. The very next year (2020), catastrophe losses are worse than your estimate and you increase your catastrophe provision to $65 billion. The next year after that (2021), catastrophe losses are still worse than your estimate and you increase your catastrophe provision to $70 billion. The main point here is that ever since 2017, catastrophe losses have suddenly and dramatically increased to a new much higher level and pricing actuaries (like me) have been or are trying our very best to make a fair, reasonable and adequate provision for this volatile result based upon the latest information available. The year 2020 was the third in a four-year stretch where industry catastrophe losses exceeded $50 billion, which was enough evidence for many pricing actuaries to insist on taking far more substantial rate increases.
Back to the question at hand. When will the large premium increases come to an end? The answer to that question depends largely on the degree to which catastrophe losses and overall loss trends level out.
A “fair and reasonable profit”
All of this data still doesn’t answer the question of exactly how inadequately priced the homeowner industry is. Well, that depends. As discussed in the prior section, part of the answer depends on accurately assessing the expected value of catastrophe losses. In addition to this, one also needs to address a different question: What “should” the homeowner insurance industry be targeting for a fair and reasonable return on capital? Based on my experiences at three different insurance carriers over a 20+ year period and my review of hundreds of competitor filings over the years, the general historical consensus seems to be that a return on capital between 10% and 15% is appropriate for the P&C insurance industry. Does that mean that the homeowner industry “should” be targeting a combined ratio between 85% and 90%? No, that would be conflating return on capital with return on premium.
To move forward, we’ll need a quick level set on the two separate components of P&C insurance profit (underwriting and investments) and how these two pieces contribute to the overall return on capital. However, before jumping into that, Table 7 summarizes the target return on capital and profit provisions for our six sample filings.
At a high level, when insurance works as designed, insurance companies (in essence) receive a loan from customers (the premium) and only pay back a fraction of the loan (the loss ratio). In order to write these policies, insurance companies must have capital set aside to ensure all claims will be paid. Insurance companies invest both the premium and the capital and earn investment income on both. Assuming an insurance company consistently targets the same return on capital every year, then the required underwriting profit (or the target combined ratio (TCR), if you prefer since U/W Profit = 100% − TCR) should be inversely related to investment yields. When yields are more favorable, smaller underwriting margins are needed and vice versa.
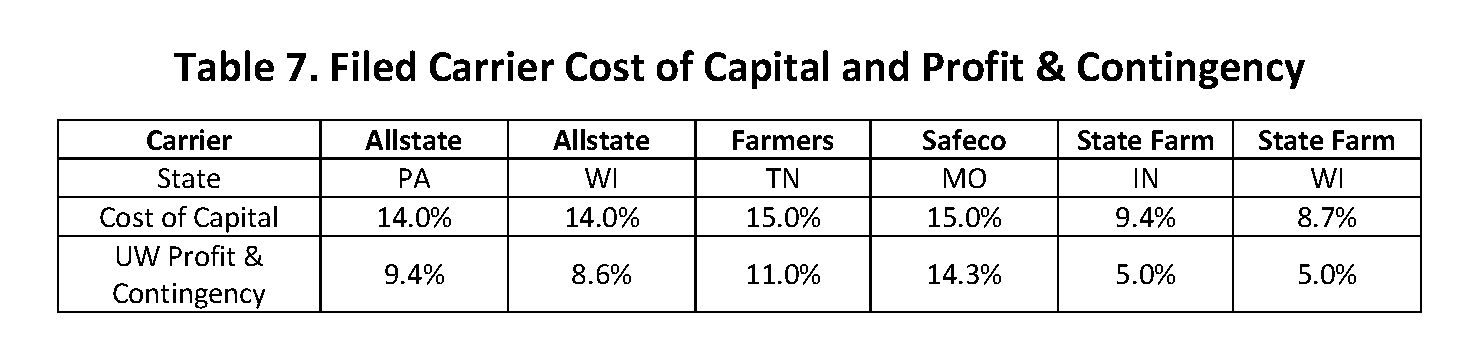
Reviewing Table 7, we see that most carriers anticipate investment returns to provide roughly one-third of the cost of capital and the rest to be gained from the amount by which insurance premiums exceed losses and expenses. As an example, the Allstate Pennsylvania filing shows that 9.4% of the 14% target return (67%) will be gained by profits on the insurance written, which means the remaining 33% will be provided by investment returns on invested capital and invested premium. Based on our small sample above (and on the author’s experience), we cautiously assert that an industrywide required underwriting profit load between 6% and 12% is appropriate. For the sake of argument, if we were to agree that 8% is the theoretically “right” underwriting profit load, then the 2023 combined ratio of 110.9% shown in Table 5b would hint that (all else equal) the industry needs total premiums to grow by over 20% in 2024 to have a reasonable chance of achieving a 92% target combined ratio.
Speculations on the road ahead
We’ve covered a lot of ground now — where does this leave us? What can we take away from all of this and what can we expect to see over the next year or two?
When inflation picked up a few years ago, insurance companies appropriately started increasing everyone’s Coverage A to ensure that everyone would be adequately insured, and this larger-than-typical Coverage A increase pushed premiums higher than usual. Inflation has subsided in the recent past and this component of premium increases will likely temper in the coming months.
The commodity price trends from BLS also appear to have subsided a bit in the latest year, so there is reason to be optimistic that loss trends will level out somewhat. The big unknown is catastrophe losses. Based upon the last seven years, one might reasonably infer that, in the longer term, the industry should be expecting close to $100 billion in catastrophe losses. However, if 2024 catastrophe results wind up looking anything like 2017, then we would have to adjust our estimates and continue to increase rates once again.
I speculate that industry written premiums will rise by more than 12% in 2024 and then in 2025, the written premiums will increase by a mid-single-digit amount. I also speculate that homeowner industry combined ratios will not dip below 100% in 2024 but will finally drop the leading “1” in 2025 once most of the rate activity finally has an opportunity to earn into the results. Time will tell. ●
Rob Kahn, FCAS, is an AVP & actuary with Horace Mann Insurance. He is also a member of the AR Working Group.