


Life. The world. The universe.
They do what they do.
And they don’t care what your opinion is or how clever you are.
And they don’t care how many years of data were used or how many variables were considered.
And just because they behaved one way for many years in the past does not guarantee they will behave that way in the future. Exciting!
In the actuarial profession, estimates and predictions are made on what is likely to occur in the future, and what ultimately comes to pass is almost invariably different. Sometimes, a lot different. At best, actuaries are only correct on average. And when estimates rely heavily upon historical averages and the averages up and change on you…
Let me show you what I’m talking about.
California wildfires: Let’s review some empirical financial facts. The facts I have in mind can be found in the official California Department of Insurance Exhibit 9. “What is Exhibit 9?” you ask.
The State of California has several rate filing templates that every insurance carrier must populate when they perform a rate filing. Exhibit 9 is the Catastrophe exhibit in that template. On Exhibit 9, each carrier quantifies the catastrophe and non-catastrophe losses paid over a 20-year (or longer) period and then the long-term ratio of total losses over non-catastrophe losses is determined. That long-term ratio becomes the catastrophe provision. As a simple example, if over a 20-year period, a carrier has $1.25 billion in total losses and $1 billion in non-catastrophe losses, then the cat load will be 1.25, which means a factor of 1.25 will be applied to the most recent non-catastrophe loss experienced to estimate total losses.
Now that we have that refresher under our belts, let’s take a gander at one specific Example 9. Please turn your attention to Table 1 where we show the catastrophe factor support (Exhibit 9) from the 2017 Farmers Insurance rate filing. Why 2017? And why Farmers? We’ll get there in a moment.
For background, Farmers is the second largest homeowners insurer in the state of California, behind State Farm and ahead of California State Auto Group. Different carriers have different geographic footprints, and the worst wildfires impacted each carrier differently. Based upon my own review of several carriers’ Exhibit 9 back in 2017, California wildfire experience all looks something roughly like this.
Back in 2017, Farmers relied upon 28 years of catastrophe experience, and that experience produced a simple average catastrophe factor of roughly 1.2. As you can see in Table 1, column 3, in five of the years, there were no catastrophe losses at all, and in five of the years, there were over $100 million of catastrophe losses. There’s a big difference between no loss and $100 million of catastrophe loss, which is why a long-term average is used.
Table 1. Farmers Cat Experience (Serff # FARM-130585739) — Exhibit 9 (3-28-2017)
![]()
Table 2. Filed Catastrophe Provision for Seven Top California Carriers (~2017)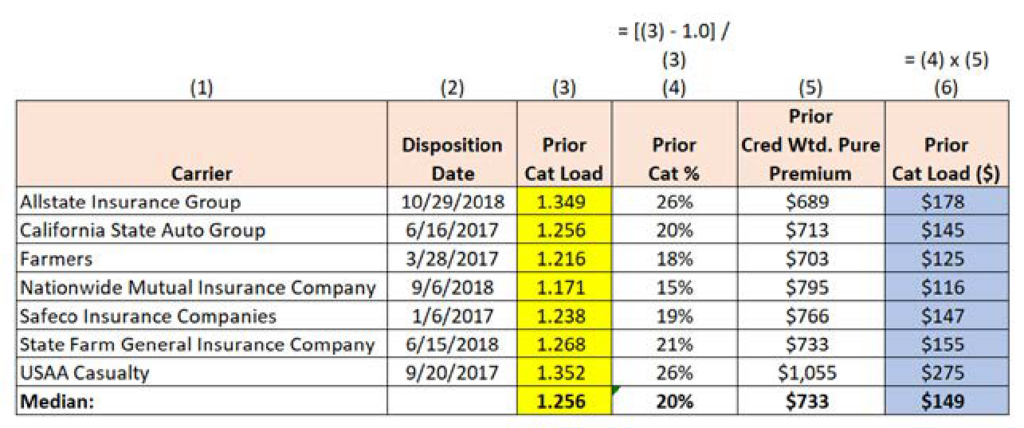
Farmers wound up using a catastrophe factor of 1.216. Farmers filed a total pure premium of $703, which implies a $125 (0.216/1.216 x $703) expected catastrophe loss per exposure provision.
OK, so one large carrier loaded in $125 for wildfires back in 2017. “What were other carriers loading in back in 2017, and what’s your point?”
Great questions! For the first question, let’s review the rate filings from a few other top carriers (over $100 million in annual written premium) that were submitted right around 2017. Those homeowners rate filings included data up through late 2016 or early 2017. Table 2 shows those results.
As we can see from Table 2, most top carriers were relying upon a cat load factor of roughly 1.25 (similar to Farmers), where results varied between 1.20 and 1.35.
Table 2 shows us that California Homeowners insurance companies anticipated roughly $150 in catastrophe loss per house-year or nearly 20% of total loss to arise from catastrophes back in 2017, because everything we knew told us that that was the right answer. So where are we going with this? Well, now that we know the prevailing California cat load wisdom circa 2017, let’s ask the next logical question: What happened between 2017 and now?
To address this question, let’s review the Top 20 Wildfires from 1991 to 2021 in Table 3.
Table 3 is sorted by date to show the most destructive California wildfires (more than 900 structures destroyed) beginning with the Tunnel Fire in 1991 and ending with the worst wildfires in 2021. Before reading any further, please stop here and carefully review the dates in Table 3 and see if something jumps out at you.

Table 3. Most Destructive CA Wildfires through 2023
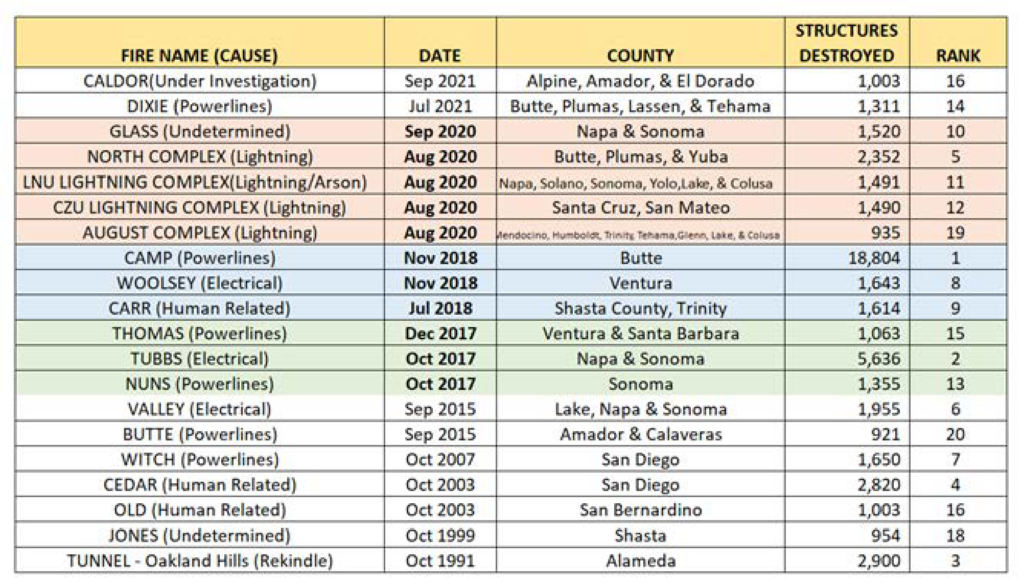
Welcome back! Did you see it? Eleven major wildfires in three years compared to seven major wildfires over 25 years! So, what does this mean? Is this a fluke or has something fundamental changed, and what is being done about this?
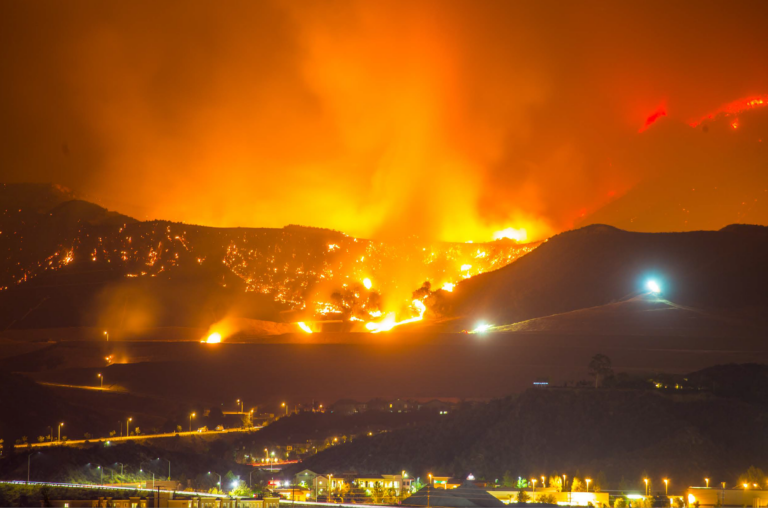
As we can see from Table 3, wildfire experience was the worst it has ever been in the three-year period between October 2017 and October 2020. At no other point in the 30+ years reviewed did we ever experience even three large wildfires in a three-year period, much less 11. Worth noting, in that super destructive three-year period with 11 named wildfires, 37,903 structures were destroyed and almost half of those destroyed buildings were due to the Camp Wildfire. In fact, the Camp Wildfire destroyed roughly the same number of buildings as the Tubbs, Tunnel, Cedar, North Complex, Valley, Witch, Woolsey and Carr Wildfires combined (the second through ninth worst wildfires on record!). A picture might help here: Figure 1 helps to explain just how incredibly destructive the Camp Wildfire was.
Let’s pause here for a moment and go on a very brief, but absolutely necessary detour regarding the Camp Wildfire. On November 8, 2018, the Camp Wildfire ignited in Butte County, California, and over the course of the following 18 days, over 18,000 structures were destroyed and 85 lives were lost. The insurance industry has never seen anything like it. Prior to the Camp Wildfire, the most destructive wildfire on record was the Tubbs Wildfire in October 2017, which leveled over 5,000 structures. Prior to that, one needs to look back more than 25 years to the Tunnel Fire (also known as the Oakland Firestorm of 1991) where 2,900 structures were lost. Comparing the Camp Wildfire to the second-most destructive wildfire, one readily sees that the Camp Wildfire destroyed more than three times as many buildings as the Tubbs Wildfire and more than six times as many buildings as the third-place Tunnel Fire.
Figure 1. Building destruction by California Wildfires

There are thousands of actuaries, modelers and all-around bright individuals trying to figure out right now how much weight to assign to this one outlier event. The question at hand is this: “Going forward, should we expect something like the Camp Wildfire to occur once every 25 years? Once every 50 years? 100 years?” The answer to this very difficult question is absolutely necessary as it allows the industry to know how much to charge for homeowners insurance in California.
The Camp Wildfire — one single event — generated a very large share of total catastrophe losses in the recent past.
Back in 2017, the prevailing wisdom was that insurance carriers were anticipating roughly $150 in expected catastrophe loss per house. There were an unusually large number of wildfires between October 2017 and October 2020. What exactly did this mean in terms of losses? To answer that, let’s go back to the most recent Exhibit 9 filed by Farmers.
Turning our attention to Table 4, we show the catastrophe factor support (Exhibit 9) from the latest Farmers Insurance rate filing.
What do we notice now?
For starters, we are now looking at fewer years of experience (20 years instead of 28 years). Older years with better catastrophe experience are now excluded from the average. In the old 2017 exhibit, there were five years with no catastrophe loss and now there are only two. In the old 2017 exhibit, there were five bad years spread over 28 years and now there are seven bad years spread over 20 years. This new updated view turns the overall catastrophe factor from a little over 1.2 to a little over 1.4. The worst three years in Table 4 (20183, 20193 and 20203) show $1.7 billion in paid catastrophe losses compared to $2.64 billion in the entire 20-year period. Nearly two thirds of all catastrophe losses in a 20-year time period occurred over just three years!
Table 4. Farmers Cat Experience (Serff # FARM-134043960) – Exhibit 9 (6-12-2024)
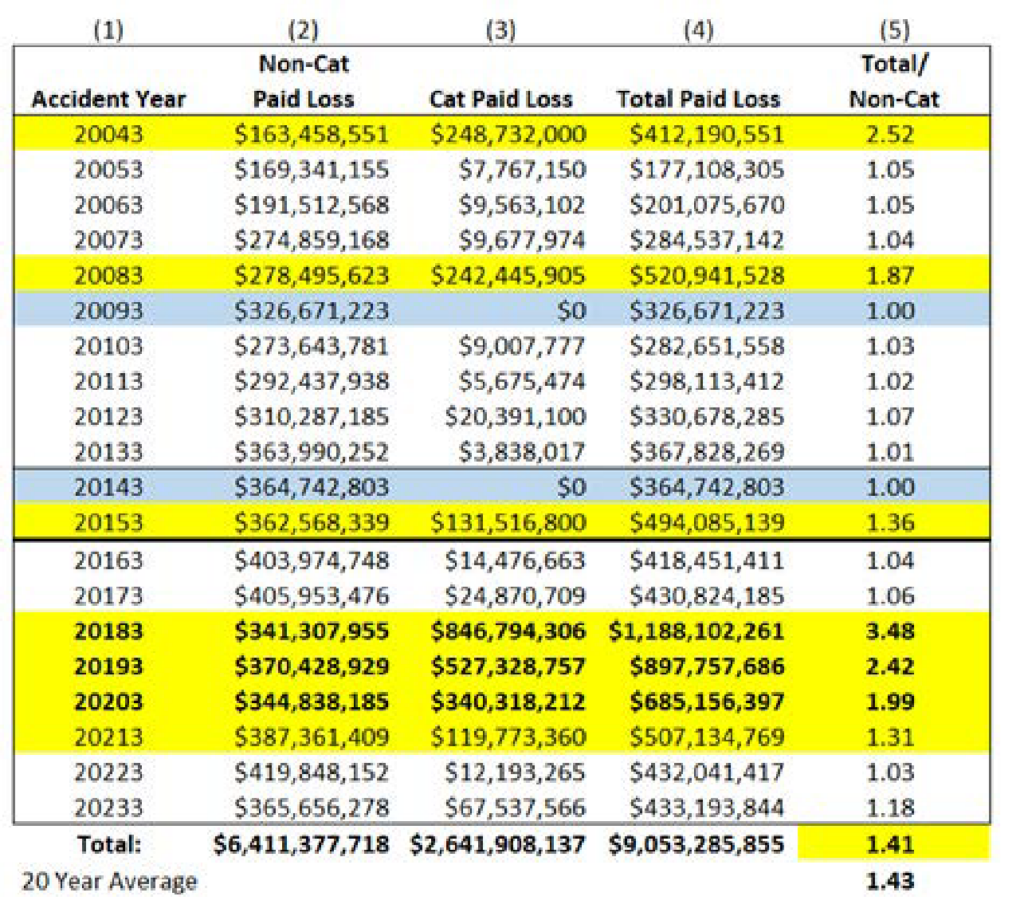
Table 5. Farmers Cat Experience (Serff # FARM-134043960) – Exhibit 9 (6/12/2024)

What about that old 2017 “$125 expected catastrophe loss per house” estimate? Based on the losses above, what actually happened each year? Table 5, column 4 addresses that question.
That old $125 expected catastrophe loss estimate appears ridiculous now, doesn’t it? Five of the last eight years are all larger than that estimate and three of those years by a very large amount. This is what I’m talking about. I’m using Farmers to illustrate the point, but virtually any other carrier in California would have supported the same narrative. Thirty years prior to October 2017 led us to believe one thing and then…life, the world, the universe…
So, what now?
Now, we pivot. We “brush ourselves off” and update our estimates.
In Table 2, back in early 2017, the industry relied upon a catastrophe factor of roughly 1.25, which means the industry anticipated 20% of total homeowners’ loss to be from catastrophes. That 20% equated roughly to a $150 pure premium. We now ask ourselves the next logical question. Now that we’ve experienced Camp and Tubbs and 2020, what are the expected wildfire losses going forward?
You all know where we’re headed — back to the most recent California homeowner rate filings from the same top carriers shown in Table 2, which were submitted right around 2024. Table 6 shows those results.
Table 6. Filed Catastrophe Provision for Seven Top California Carriers – Today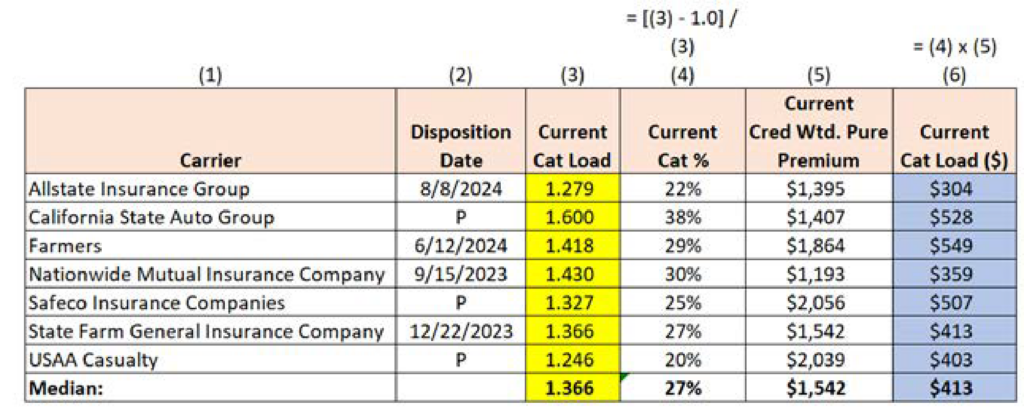
Table 6 shows that most top carriers now anticipate over $400 in catastrophe loss per house year or nearly 27%+ of total loss to arise from catastrophes. The consensus cat load range increased from 1.20-1.35 in 2017 to 1.25-1.45 in 2023. Total expected losses more than doubled between 2017 and 2023 and the cat load nearly tripled.
Where does all of this leave us?
Back in September 2017, we had never experienced anything like the Camp Wildfire or the Tubbs Wildfire or even the 2020 Wildfire season. Based upon the history we had at our disposal, we collectively estimated $150 in expected wildfire losses per California home and charged California residents accordingly. Since September 2017, we’ve experienced individual wildfires and wildfire seasons unlike anything we’ve seen before. Based on this new information, recent rate filings from multiple top homeowners’ insurance carriers imply that annual wildfire pure premiums in California are now estimated to be something in the $400 to $500 range as opposed to around $150.
Perhaps these revised estimates are still too light? Maybe what we experienced between 2017 and 2020 was more in line with what we are going to be seeing from this point forward. Perhaps something has changed and we just don’t fully recognize or understand it yet.
Or perhaps these revised estimates are too heavy? Maybe we are putting too much weight on just a few recent, random, isolated outlier events and it would be more appropriate to take a longer-term average producing a lower catastrophe estimate.
Which is it? Well, that all depends on…
Life. The world. The universe.
Rob Kahn, FCAS, is an AVP & Actuary with Horace Mann Insurance. He is also a member of the AR Working Group.