


The term social inflation isn’t new — Warren Buffett used it in the 1970s to describe “a broadening definition by society and juries of what is covered by insurance policies.”[1] You hear it a lot today as insurance companies try to describe the contemporary societal forces that they believe are accelerating loss costs.
“The concept of social inflation is hard to define,” writes Christopher Mackeprang, senior actuary at General Reinsurance, “which makes it hard to find empirical evidence that supports or disproves it.” Mackeprang is Gen Re’s treaty pricing analyst and vice president.
We decided to try. And we found that traditional loss triangles provide evidence that social inflation increased aggregate losses by more than $20 billion between 2010 and 2019 in commercial auto liability insurance alone.
Our research was published in February 2022, in “Social Inflation and Loss Development,” a joint publication of the CAS and the Insurance Information Institute (Triple-I). We examined industry loss triangles from Annual Statement Schedule P and found loss development patterns that are consistent with most descriptions of social inflation.
Our paper defined social inflation as excessive inflation in the size of claims. Some believe social inflation is also driving up claim frequency; for example, the brokerage Amwins suggested that social inflation was caused by “an increase in both frequency and severity of liability claims … driving up the cost of claims, but also contributing to rate increases across the board.” But claim frequency was outside the scope of our work.
This article will summarize our work and provide some pricing and reserving considerations for actuaries. The complete paper goes into detail showing how we used macroeconomic data to normalize and identify trends in premium and losses and how actual vs. expected analysis can shed light on social inflation trends.
 In our paper, we assert that basic actuarial techniques such as the chain-ladder method assume that losses move from unreported to reported in a consistent, predictable manner, albeit with some random variation. Many factors drive that movement, one of which is inflation. Embedded in the typical process of selecting a loss development factor — taking the average of several link ratios — is the assumption that development factors are values taken from a random process with a stable mean. When you take an average, you are implicitly saying that inflation over the period has been constant.
However, if losses accelerate, age-to-age factors will increase from accident year to accident year. The process no longer has a stable mean. The instability could, in theory, have many causes, but for the data we examined, we assert that the most likely reason is an excessive increase in the size of claims, or, in modern parlance, social inflation. We discuss other data considerations that could impact development patterns, such as homogeneity, reinsurance and operational changes. These will have a greater impact on an individual company’s development patterns while the impact will be more muted at the industry level.
We looked at U.S. industry loss development triangles from the National Association of Insurance Commissioners as reported by S&P Global Market Intelligence. We looked at several lines of business, but this article will focus on commercial auto liability.
Table 1 shows the net paid loss and defense and cost containment (DCC) link ratio triangle for commercial auto liability from 2000 to 2019. Red highlighting in a cell indicates that the link ratio increased relative to its counterpart in the prior year. As can be seen, there is a lot of red for commercial auto liability.
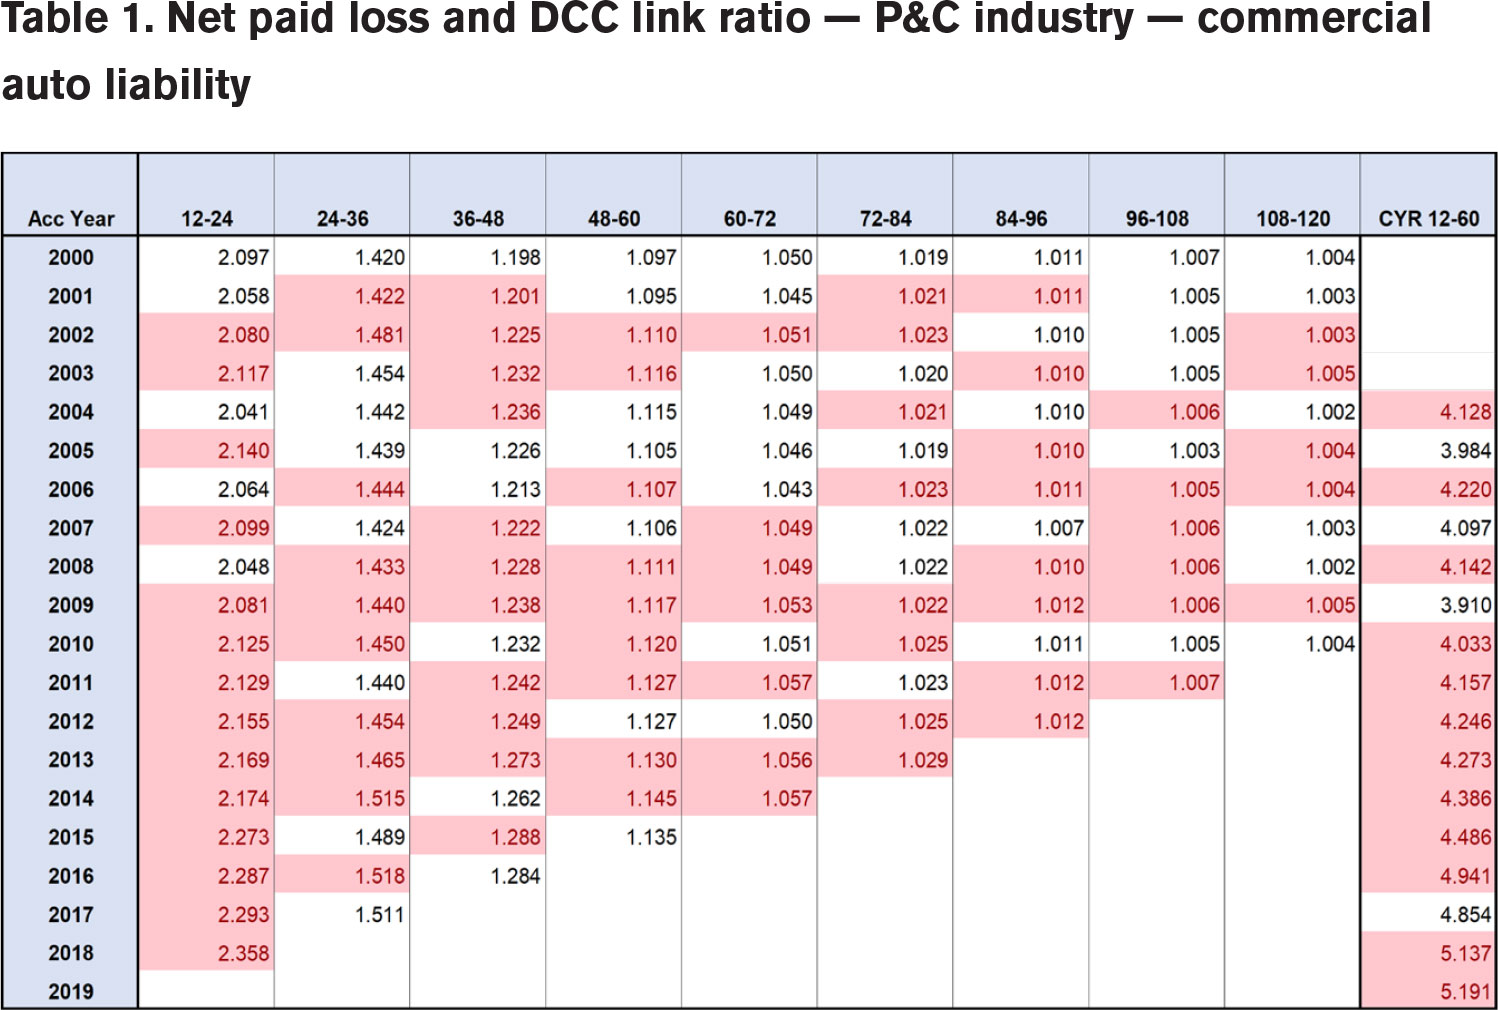
Every column in this exhibit should look familiar to casualty actuaries — except the last. The last column is the product of the 12-to-24-, 24-to-36-, 36-to-48- and 48-to-60-month link ratios along a given diagonal of the development triangle. We call this the calendar year 12-60 development factor (CYR 12-60).
For example, the 2019 CYR 12–60 development factor shown in Table 1 is 5.191. This equals the product of the 12-to-24-, 24-to-36-, 36-to-48- and 48-to-60-month link ratios along the latest diagonal (= 2.358 × 1.511 × 1.284 × 1.135). The 2018 CYR 12-60 development factor is 5.137, being 2.293 × 1.518 × 1.288 × 1.145.
If the CYR 12-60 factor is higher than its predecessor, that is evidence of growing inflation. Chart 1 is a visual representation of the CYR 12-60 ratios shown in Table 1. Note the steady increase in the factor since 2009.
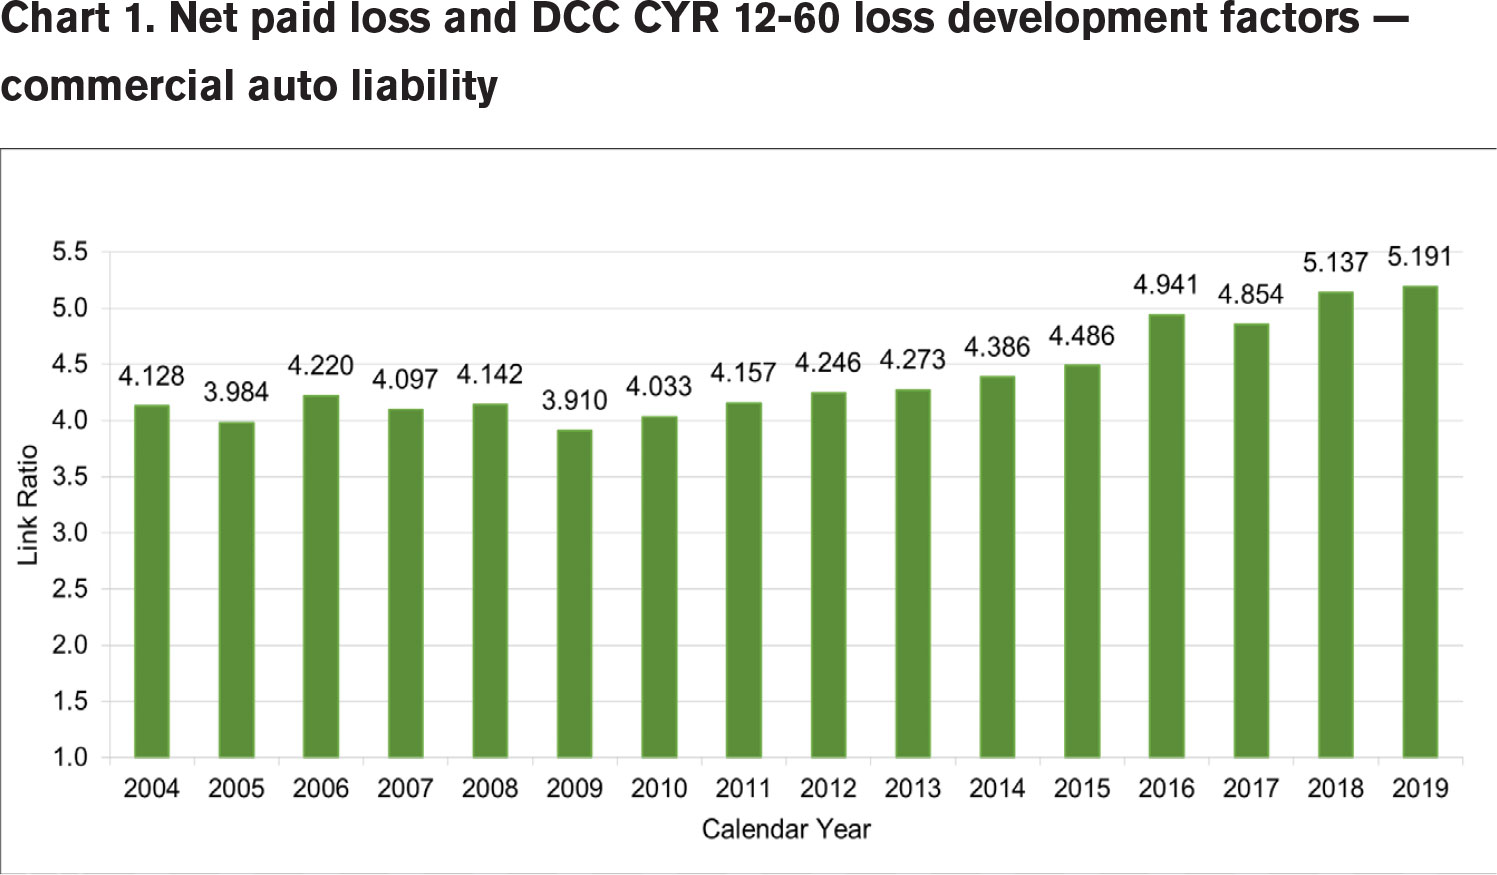
We observe a low point in the paid CYR 12-60 LDFs at calendar year 2009. Since 2009, this metric has increased every year with the exception of 2017. The calendar year 2018 LDF increased above both the 2016 and 2017 LDFs.
We saw the same sort of pattern for case incurred losses, as shown in Chart 2.
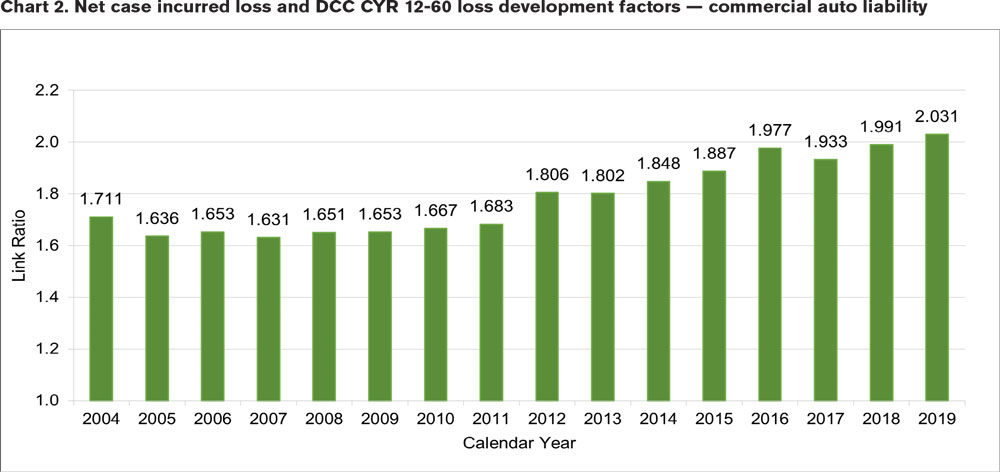
The low point occurs at calendar year 2007. Again, the CYR 12-60 LDFs show a clear, increasing pattern. Small decreases are observed in 2013 and 2017, but those were followed by increases to levels higher than the two preceding years in each case. The case incurred CYR 12-60 LDFs began increasing in 2008, two years sooner than the paid CYR 12-60 LDFs.
We performed similar calculations for other lines of business. We determined that CYR 12-60 LDFs were generally lowest around 2008. We saw increasing LDFs for commercial auto, other liability (occurrence) and medical malpractice (claims made), particularly from the late 2000s and onward.[2]
Looking at these factors, it is clear that something is driving loss development factors higher. We know it is not general inflation, which stayed fairly consistent from 2010 to 2019. We attributed it to social inflation.
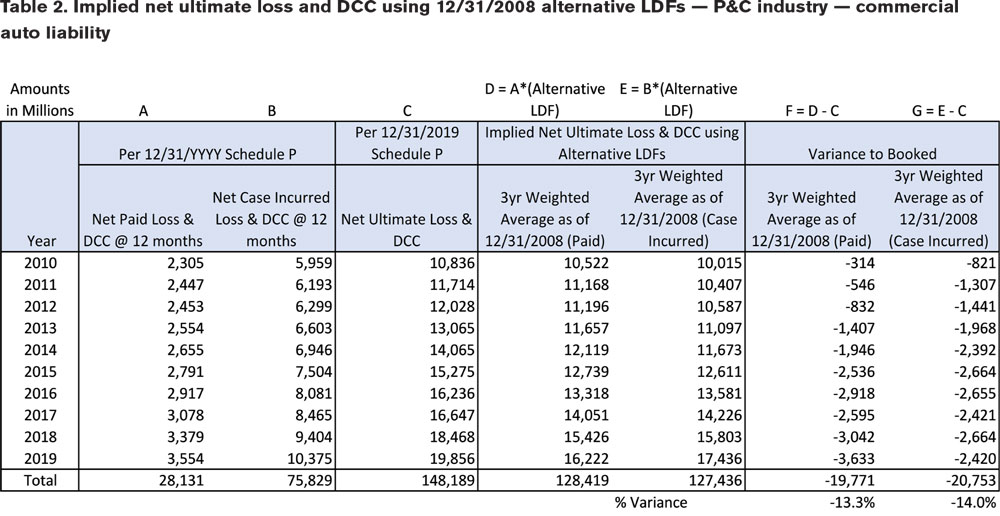
Next, we tried to quantify the impact of rising LDFs. We calculate an implied net ultimate loss and DCC for commercial auto liability based on the paid and case incurred loss development methods using alternative LDF assumptions for accident years 2010 to 2019. These alternative LDF assumptions are based on using three-year weighted average link ratios from the latest three calendar years as of December 31, 2008. We reason that in the absence of social inflation, loss development factors would not have crept higher.
We calculated the implied ultimates using the historical paid and case incurred loss and DCC at 12 months and applied the 12-to-ultimate implied LDFs as of December 31, 2008. This allows inclusion of all loss development caused by increased LDFs after 12 months.
The results are displayed in Table 2. Columns F and G show the difference between the booked ultimate and what would have been booked in a world without social inflation. This method indicates that the potential impact of social inflation is approximately $20 billion, or roughly 14% of all booked commercial auto liability losses over the 10 years we examined.
This method likely understates the impact of social inflation for at least two reasons:
- It does not consider any inflation in losses reported or paid within the first 12 months of an accident year, so in that sense it could be considered an underestimation.
- It does not consider any potential deficiency in the booked amounts as of December 31, 2019.
In our paper, we estimated that booked net ultimates were understated by $1.9 billion to $3.9 billion. In the years since 2019, commercial auto liability booked losses for 2010 to 2019 have risen $3.2 billion, consistent with our analysis.

Actuaries who believe they are encountering social inflation should take care when selecting link ratios and methods on which to rely. If using the loss development method, actuaries should consider selecting link ratios from the most recent development year or even extrapolating link ratios instead of any multiyear average. They should consider giving greater weight to the methods that are performing better in an actual versus expected analysis.
Actuaries should also be sure to communicate with other stakeholders — claims and management — the nature of what they are seeing and how they are addressing it. Actuaries at larger companies should look for similar phenomena in their books of business. Those at smaller companies, where lower volume results in greater variability in LDFs, should consider analyzing countrywide data to track the phenomenon.
We want to thank again the Casualty Actuarial Society and the Insurance Information Institute for supporting our work. We are working on a follow-up study looking at the COVID years and the current high-inflation environment.
[1] Warren Buffett, “Chairman’s Letter—1977,” March 14, 1978, accessed June 15, 2021, https://www.berkshirehathaway.com/letters/1977.html.
[2] It should be noted that, although these metrics do not show social inflation for some lines of business, it does not necessarily mean there is no social inflation. Other liability (claims made) is an example. We believe social inflation is having a significant impact on other liability (claims made); however, we do not see evidence of that in these link ratios. It may be that the risks in these are so heterogeneous that the noise of random variation across many different products overwhelms any signal of inflation that could show itself in development factors.
Jim Lynch, FCAS, MAAA, recently retired from his position as chief actuary at Triple-I and has his own consulting firm. Dave Moore, FCAS, MAAA, CERA is head of Moore Actuarial Consulting.