In recent years, there has been a significant increase in the frequency of weather-related catastrophe events (acts of nature) such as wildfire, severe storms (including hurricanes, tornados and hail) and others (including flood and winter storms). The issue is exacerbated by an increase in the aggregate cost of weather-related claims due to soaring rebuilding and reinsurance costs. During the last Annual Meeting in Pheonix, Arizona, in the session, “Herding your Cats: Managing and Pricing Catastrophe Exposure,” Sheri Scott, FCAS, CSPA, from Milliman, Inc. and Robert Silva, ACAS, from Zesty.AI, presented on the topic before an overflowing audience. The number of weather-related events exceeding $1 billion in loss in today’s dollars has been steadily increasing, reaching an all-time record high of 28 in 2023.
Figure 1. Weather-Related Catastrophe Events

The main goal of the presentation was to educate the audience on how to better segment the risk and increase pricing sophistication of various climate related perils. Charging high-cost risks adequately can prevent insurer insolvencies, especially for smaller insurers, and improve insurer profitability. Once insurers are more comfortable with their ability to price catastrophe-exposed properties and earn a fair return, these insurers will return to the market and lessen the burden on property owners facing limited insurance availability options. The challenge for actuaries is how to price for low-frequency, high-severity events when each insurer’s own experience data offers such low credibility. Traditionally, the solution has been to use a longer historical experience period of 20 to 50 years. However, given the increase in weather-related catastrophe events in recent years, as depicted by Figure 1, using historical experience would not be representative of what we expect in the future. ASOP 39 — Treatment of Catastrophe Losses in Property/Casualty Insurance Ratemaking, was drafted in 2000 to provide guidance to actuaries pricing catastrophe-exposed risk. The background section of ASOP 39 explains how traditional methods of using 20 to 50 years of historical catastrophe experience relative to non-catastrophe experience to price catastrophe-exposed risk could drastically understate the expected risk, especially if a catastrophe expected only once in 100 years or more did not occur, an insurer’s exposure to catastrophe shifted, or the number or cost of catastrophe events has been increasing during the experience period.1 The presentation aimed to demonstrate how actuarial methods have shifted from using historical experience to using catastrophe model average annual loss (AAL) output to price for catastrophe at the state or territory level and is now in the process of becoming even more sophisticated, enabling insurers to price at the individual property level.
Improvements in pricing and underwriting of catastrophe risks
The solution proposed in the presentation is based on property-specific rating, while traditionally, catastrophe risks have been rated on a less granular basis such as state/province or territory level. Old methods are no longer recommended by ASOP 39 because they are less reflective of climate changes and ignore recent trends. In addition, older methods do not capture the disproportionate impact on various properties in terms of their susceptibility to certain risks and how they would respond to different perils, ultimately leading to adverse selection and cross subsidization across segments.
The presentation started with demonstrating how a common current method is to split the catastrophe from the non-catastrophe perils and to utilize catastrophe model output to price the catastrophe perils by calculating the average annual losses for each property in-force then aggregate to the state or territory level to obtain a catastrophe rate. The benefits of the current method, compared to the traditional historical catastrophe to non-catastrophe experience loss method, is that it better accounts for any changes in exposure or risk over time. Because the rates are developed specifically for the catastrophe peril, it also allows the actuary to allocate expenses, including net cost of reinsurance to the catastrophe peril. Some of the limitations of using catastrophe model AAL output to develop catastrophe rates for territorial or some basic property-level features are the range of results between different catastrophe model vendors and explaining this difference to regulators and policyholders. (Property-level features can include year built, square footage and other secondary modifiers that the catastrophe model considers.) In addition there are costs associated with licensing and training staff to use the catastrophe models for ratemaking in accordance with the catastrophe model license agreements.
Figure 2. Case study for hail and wildfire

Another strategy, outside of pricing, that insurers have commonly used to manage their exposure to catastrophe has been underwriting actions. Insurers can use underwriting to manage aggregation or concentration risk to catastrophe, or to avoid accepting risks that the insurer cannot get adequate rate to cover all costs of risk transfer, such as when they are unable to get adequate rate increases to cover the increasing weather-related claim frequency, increasing cost to rebuild, increasing cost of reinsurance and increasing cost of capital to cover large-severity events such as a catastrophe. Underwriting actions include introducing higher deductibles for catastrophe events, limiting coverage (for example sub-limits) and excluding coverage completely for certain perils (for example ex-wind or ex-wildfire policies) or geographies. The latter is called the “sledgehammer approach” and leaves insureds with limited options. For example, some underwriting eligibility guidelines may not provide wind coverage for properties that are within one mile from the coast or may not accept properties within 10 miles of the wildland urban interface (WUI); these scenarios present too much wildfire risk for the insurer. More surgical underwriting approaches may broaden acceptance criteria based on mitigation measures, for example, clearing vegetation from the property to reduce wildfire risk.
In contrast to commonly used methods such as catastrophe modeling or the underwriting sledgehammer approach, Sheri presented a more modern and granular method for catastrophe rating and underwriting that is done at a property level. This method leverages property-level characteristics, climate data, aerial imagery, local community information and knowledge about what drives losses for each catastrophe peril. Data at the property level is combined and a model to predict the probability that a specific peril will occur on a specific property is built. It takes an extensive amount of data, time and expertise to acquire the data and develop catastrophe-specific models that account for correlation between variables and can be easily applied by insurers in underwriting and rating. Although insurers could each go through the process of acquiring the data and building the models, the amount of data, expertise and time is expensive and impractical for each insurer to undertake. Insurers can get to market quickly by licensing risk models from third-party vendors.
ZestyAI hail score
Once such third-party vendor that has created peril-risk scoring models is ZestyAI. Silva described how the Z-HAIL, ZestyAI’s risk model for hail, was built to predict the probability that a hail claim will occur at the property location and the relative severity of that claim. The model leveraged data from multiple insurers, the industry and climate-related data, which addresses the lack of credibility issue that a single insurer is faced with when attempting to build such a model on their own. Information specific to each property is obtained using high resolution aerial imagery. Then ZestyAI utilized physical science research to prove the causal relationship of certain variables such as roof condition, susceptibility of roofing material in relation to the size of hail stone, and resulting damage after exposure to multiple hail storms. Traditionally, the data used favored the “salient event” approach where only hail events with more than 2″ sized hail were considered, ignoring smaller and less conspicuous hail stones (smaller than 1″ and accounting for 99.4% of all stones) that causes detrimental consequences for future events.
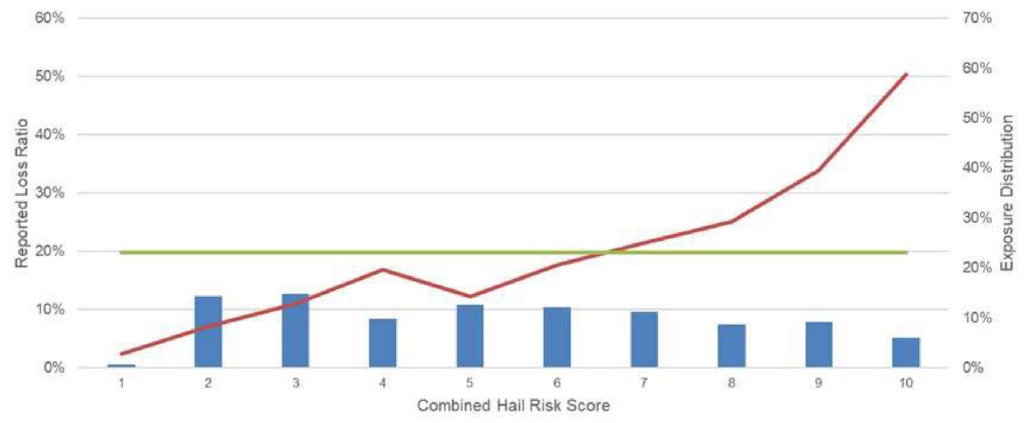
Figure 3. Case Study Results
During the process, some findings from working with the Insurance Institute for Business and Home Safety (IBHS) is that climate, meteorology, geospatial and location data are important considerations for predicting damage from hail, but that the roof condition and characteristics of the property overpower the other factors. The ability of the roof to mitigate hail damage is more crucial to an insurer than the exposure to hail risk. By the same token, the Z-FIRE score takes into account the vegetation surrounding the property, which is specific to a particular property and the property owner can improve, compared to the slope of the land, which does not change over time and the homeowner cannot change.
Finally, for implementation purposes in rating, the Z-HAIL scores can be provided on all properties in an insurer’s book of business. The properties can then be segmented into 10 buckets for the frequency of an event and five buckets for expected severity of the damage, creating 50 unique segments of risk. (See Figure 2.) The red boxes represent the highest risk score segment, and the green boxes represent the lowest risk score segments and can be used to perform underwriting and rating in a more segmented manner.
The session closed with a discussion of a hail and wildfire case study that Milliman conducted to evaluate whether the Z-HAIL scores improved risk segmentation and could be used to improve an insurer’s rate plan. The case study started with assigning a Z-HAIL score to each property on the effective date of the policy during an experience period, and then grouping the property policies into 10, somewhat equal segments of risk, based on the Z-HAIL score. The reported loss and earned premium on each property during the policy term was then aggregated within each of these 10 buckets and the loss ratio for each bucket calculated. The results, depicted in Figure 3, demonstrated that as the Z-HAIL score increased, meaning that the probability of hail exposure and hail loss increased, the loss ratio generally also increased. The model’s ability to differentiate the riskiest properties from the least risky properties, using 10 segments of risk, was significant with a loss ratio relativity of about 21, or that the riskiest properties are 21 times more likely to have a hail claim than the least risky properties.
Sandra Maria Nawar, FCAS, ACIA, is a data science manager at Intact Financial Corporation in Toronto. She is a member of the Actuarial Review Working Group and Writing Sub-group.
1 ASOP 39 provides examples from Hurricane Andrew in 1992 and the Northridge earthquake of 1994, which “clearly demonstrated the limitations of relying exclusively on historical insurance data in estimating the financial impact of potential future events.”
References


