


The 2025 CAS Spring Meeting in Toronto was a great opportunity to offer sessions comparing the P&C insurance markets in Canada and the United States, reinforcing the global mission of the CAS and educating the many actuaries who practice solely in one country.
The Tuesday morning general session featured an overview of secondary perils in both countries, which offered many more similarities than contrasts. Jason Machtinger of Aon opened by presenting the global and Canadian overview, followed by my overview of the U.S. markets.
Primary and secondary perils with catastrophes
Insurance industry convention is to define primary perils as earthquakes and hurricanes. These perils produce the highest severity of catastrophe losses (referred to as probable maximum loss, or PML), drive significant capital requirements, and are heavily modeled. On the other hand, secondary perils, such as severe convective storms (SCSs), floods, and wildfires, are more frequent but usually less severe.
When it comes to secondary perils, catastrophe models give us a useful — although incomplete — view of the exposure of a portfolio. For example, the Fort McMurray wildfire in 2016 was the largest in Canadian history, and yet wildfires are not commonly modeled in the Canadian market. Winter Storm Uri in 2021 caused an approximate USD $15 billion loss, but models missed its likelihood. Flood is a further challenge, with models being updated and improved regularly.
Machtinger highlighted the overriding theme of the session that secondary perils can no longer be dismissed as less important than primary perils. Secondary perils accounted for 100% of Canadian losses in 2024 and 95% on average from 2008–2024. Canada experienced record losses in excess of CA$9 billion, well above the prior record of CA$5 billion in 2016 and a 15-year average of CA$2 billion. In 2024, significant losses included the Calgary Hailstorm (CA$3.25 billion) and Jasper Wildfire (CA$1.23 billion).
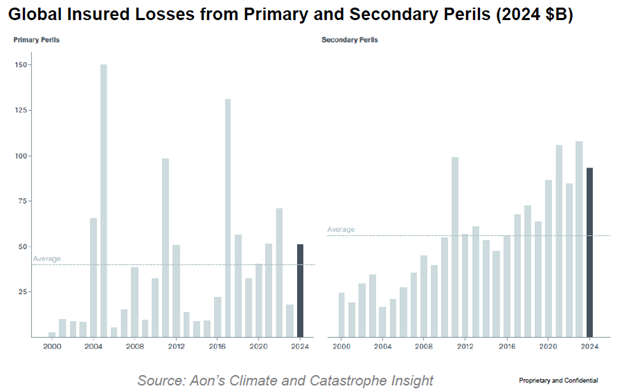
From 2000–2024, the average global insured losses for secondary perils have been well above primary perils, as captured in the graphic below. Of greater concern, secondary perils have been steadily increasing for the last 20 years, driving the spread in averages to grow year-after-year. This was true in 2024 despite several hurricanes making landfall in the U.S.
What’s driving these adverse trends in secondary perils?
Machtinger elaborated on three underlying drivers: urbanization, reduced protection gap, and climate-related effects. The 2024 Calgary Hailstorm was a record-setting loss event primarily due to urbanization. The event came across the northern portion of the city, which has undergone dramatic growth over the past four decades, resulting in a large concentration of property and auto risks, particularly around the highly exposed Calgary International Airport.
 Protection gap is defined as the portion of total economic loss not covered by insurance contracts. Canada has experienced a reduction in the protection gap over the last 24 years, and most notably in the last four years, from 52% since 2000 to 39% since 2020 to 30% in 2024. This is a credit to insurance carriers offering broader coverage for the right price on emerging perils, notably flood as a response to major losses in 2013 in Toronto and Calgary. Even with the progress, protection gap remains a systemic challenge for wildfire and flood risks.
What can be done to mitigate losses from secondary perils?
Effective mitigation strategies are essential to reduce the impact of secondary perils on communities and insurers. Machtinger captured these strategies in three timespans:
- Pre-event preventative measures like investments by insured and insurer for their mutual benefit.
- During events like early warning systems, evacuation, and specialist remediation.
- Post-event strategies involve the role of (re)insurance in recovery efforts.
Preventative measures provide the biggest mitigation opportunity. This begins with policyholder education about the risks they face and what they can do to make a difference. Segmented insurance pricing and mitigation credits are a key signal of the education and incentive feedback loop. In a wildfire exposed area, fire-resistive roofs and removal of fuel sources like brush help reduce risk. Waterproofing and backwater valves help with other perils.
Transitioning to the U.S. perspective
Building on Machtinger’s global and Canadian perspective, I jumped in with two opening comments before sharing the U.S. perspective. First, given the power in names, I concur with the misnomer of secondary perils. They may be secondary in the eyes of catastrophe models, but they certainly cannot be for property owners and insurers.
Second, I warned the audience to never take our data sources for granted. The U.S. National Oceanic and Atmospheric Administration (NOAA) is experiencing significant budget cuts in 2025. Many outstanding, knowledgeable staff and researchers have already departed, and budgets for much weather data collection and reporting have been impacted. This will likely affect pre-event predictions and warnings as well as data quality collected after events to improve modeling efforts.
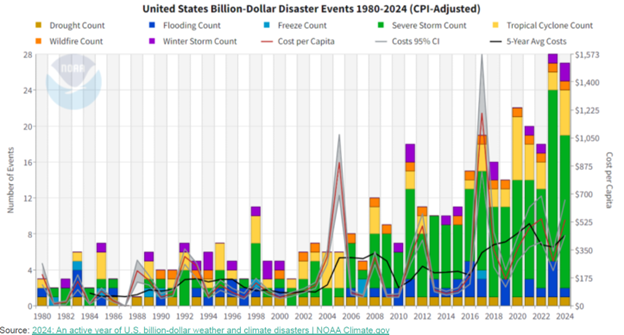 I then transitioned to the overview of U.S. catastrophe experience, using two commonly referenced exhibits from NOAA. U.S. insured losses have increased 11-fold from the 1980s to the first half of the 2020s, from $8.9 billion to $104.1 billion. This includes a dramatic rise in the number of SCSs causing more than $1 billion in losses in the last 15 years. In 2024, the U.S. experienced 27 billion-dollar disasters, with a total economic loss of $183 billion. This was the second highest number of events (after 28 in 2023) and the fourth worst loss in that timeframe.
Key drivers of climate risk
I highlighted multiple drivers behind the 11-fold increase in catastrophe losses.
- More homes and businesses being built in harm’s way — a multi-decade trend of people moving to higher-risk areas.
- Property replacement costs increasing faster than overall inflation — again, a multidecade trend, amplified by supply chain disruption during the COVID pandemic.
- Rising global surface temperatures — most notably since the 1970s.
- Legal system abuse — e.g., contractor-fueled excessive roof claims.
Severe convective storms and insured losses
SCSs have become a leading cause of insured losses in the U.S., with record losses reported in recent years. SCSs caused 48% of U.S. insured losses in 2024, more than the 39% caused by the above-average frequency tropical cyclone season. U.S. carriers paid a record $64 billion in SCS losses in 2023, followed by $56 billion in 2024.
Per studies by Swiss Re and others, the frequency of SCS events is stable, while the loss severity is increasing approximately 8% annually in the last decade. When they decomposed the 8%, they estimated 2.2 points from economic inflation with another 1.2 points from replacement costs above inflation. They estimated 2.3 points from economic growth, which includes urbanization and migration patterns to higher risk geographies, and 1.0 points for changes in the climate itself. This left 1.3 points for all other, inclusive of legal system abuse.
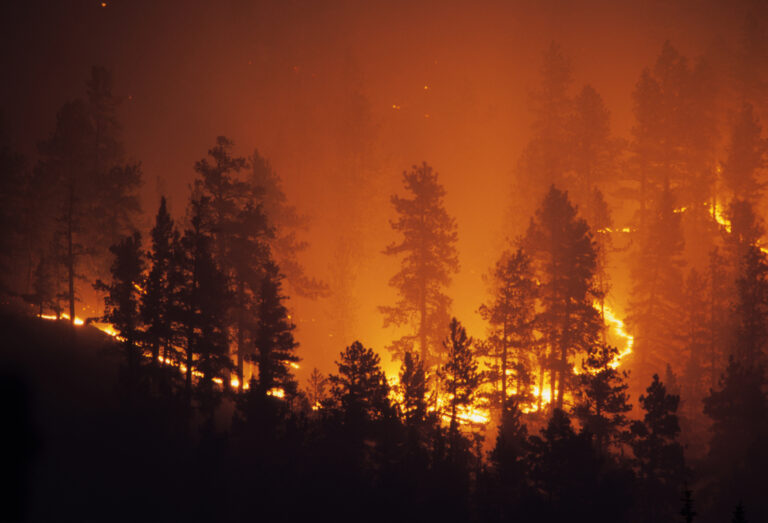
Wildfire risk and climate trends
The U.S. is experiencing increased wildfire risk and insured losses across the country. While California has the highest number of homes at risk of extreme wildfires due to increased building in the wildland urban interface (WUI), long-term trends of higher temperatures and low precipitation contribute to elevated risk across much of the western U.S.
Many are surprised to learn that 87% of U.S. wildfires are human-caused, but lightning-caused fires burn more acres on average and in total. Fortunately, the frequency trends from 2001–2023 have been declining for both cause types, but the trend in total acres burned has not declined due to average severities. The Palisades and Eaton fires in January 2025 are expected to be the two costliest wildfires in U.S. history, with the next four all occurring from 2017–2023.
Strategies for mitigating climate risk
Given that we cannot control or reverse most of the underlying causes in the short term, our efforts must focus on reducing the risk by improving the resilience of the homes, businesses, and communities impacted by all types of catastrophes. This will require individual homeowner accountability and broad collaborative efforts to drive behavioral change to predict, prevent, and reduce the severity of losses.
In parallel, insurance carriers and actuaries must work to maintain adequate rates and insured amounts, explore risk sharing with policyholders and reinsurance markets, and review coverage availability. All of these are causing and will continue to cause challenges with the affordability and availability of property insurance in high-risk markets. These are not easy times for consumers, insurers, or policymakers.
For a deeper dive on how to price for secondary perils, I refer you to the recently published CAS research paper on SCS pricing. Julia Hornack and Jeff Schmidt of Guy Carpenter presented a summary of their paper in the concurrent session that immediately followed our general session, and I wrote a summary of their session for this issue of the Actuarial Review. Their paper provides a good overview of the challenges and offers four methods for actuaries to consider when pricing SCSs and other secondary perils. May your learning always continue!
Dale Porfilio, FCAS, MAAA, is senior director, head of personal and commercial lines business development for insurance consulting and technology at WTW, beginning July 14, 2025. He was formerly chief insurance officer at the Insurance Information Institute and president of the Insurance Research Council.