


Latino Community in the CAS
United States Membership and Candidate Data as of December 2022
The CAS is sharing demographic data of members and candidates to be transparent about our diversity efforts and to hold ourselves accountable.
CAS Community Today
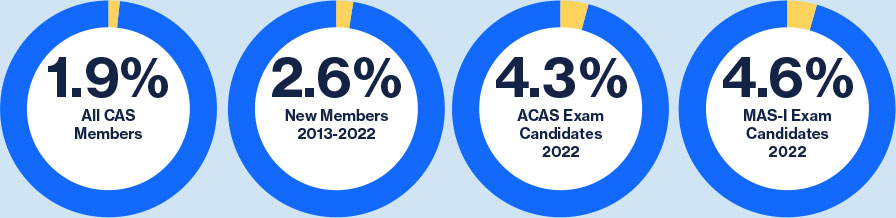
78% of US members, 91% of US members in the last 10 years, 92% of US ACAS candidates in 2022, and 93% of US MAS-I candidates in 2022 voluntarily reported their race/ethnicity.
Comparison to External Benchmarks
Latinos make up 15% of the US population Ages 25 & Up

US population, Ages 25 and up, estimated for 2019 by US Census Bureau, Population Division.
Insurance Industry Employees in 2021 based on Bureau of Labor Statistics Current Population Survery.
Mathematics Employees from 2017-2019 based on Pew Research Center analysis of American Community Survey.
Science, Technology, Engineering and Math (STEM) and Business Bachelors Degree Conferred in 2019–2020 based on National Center for Education Statistics Digest of Education Statistics.
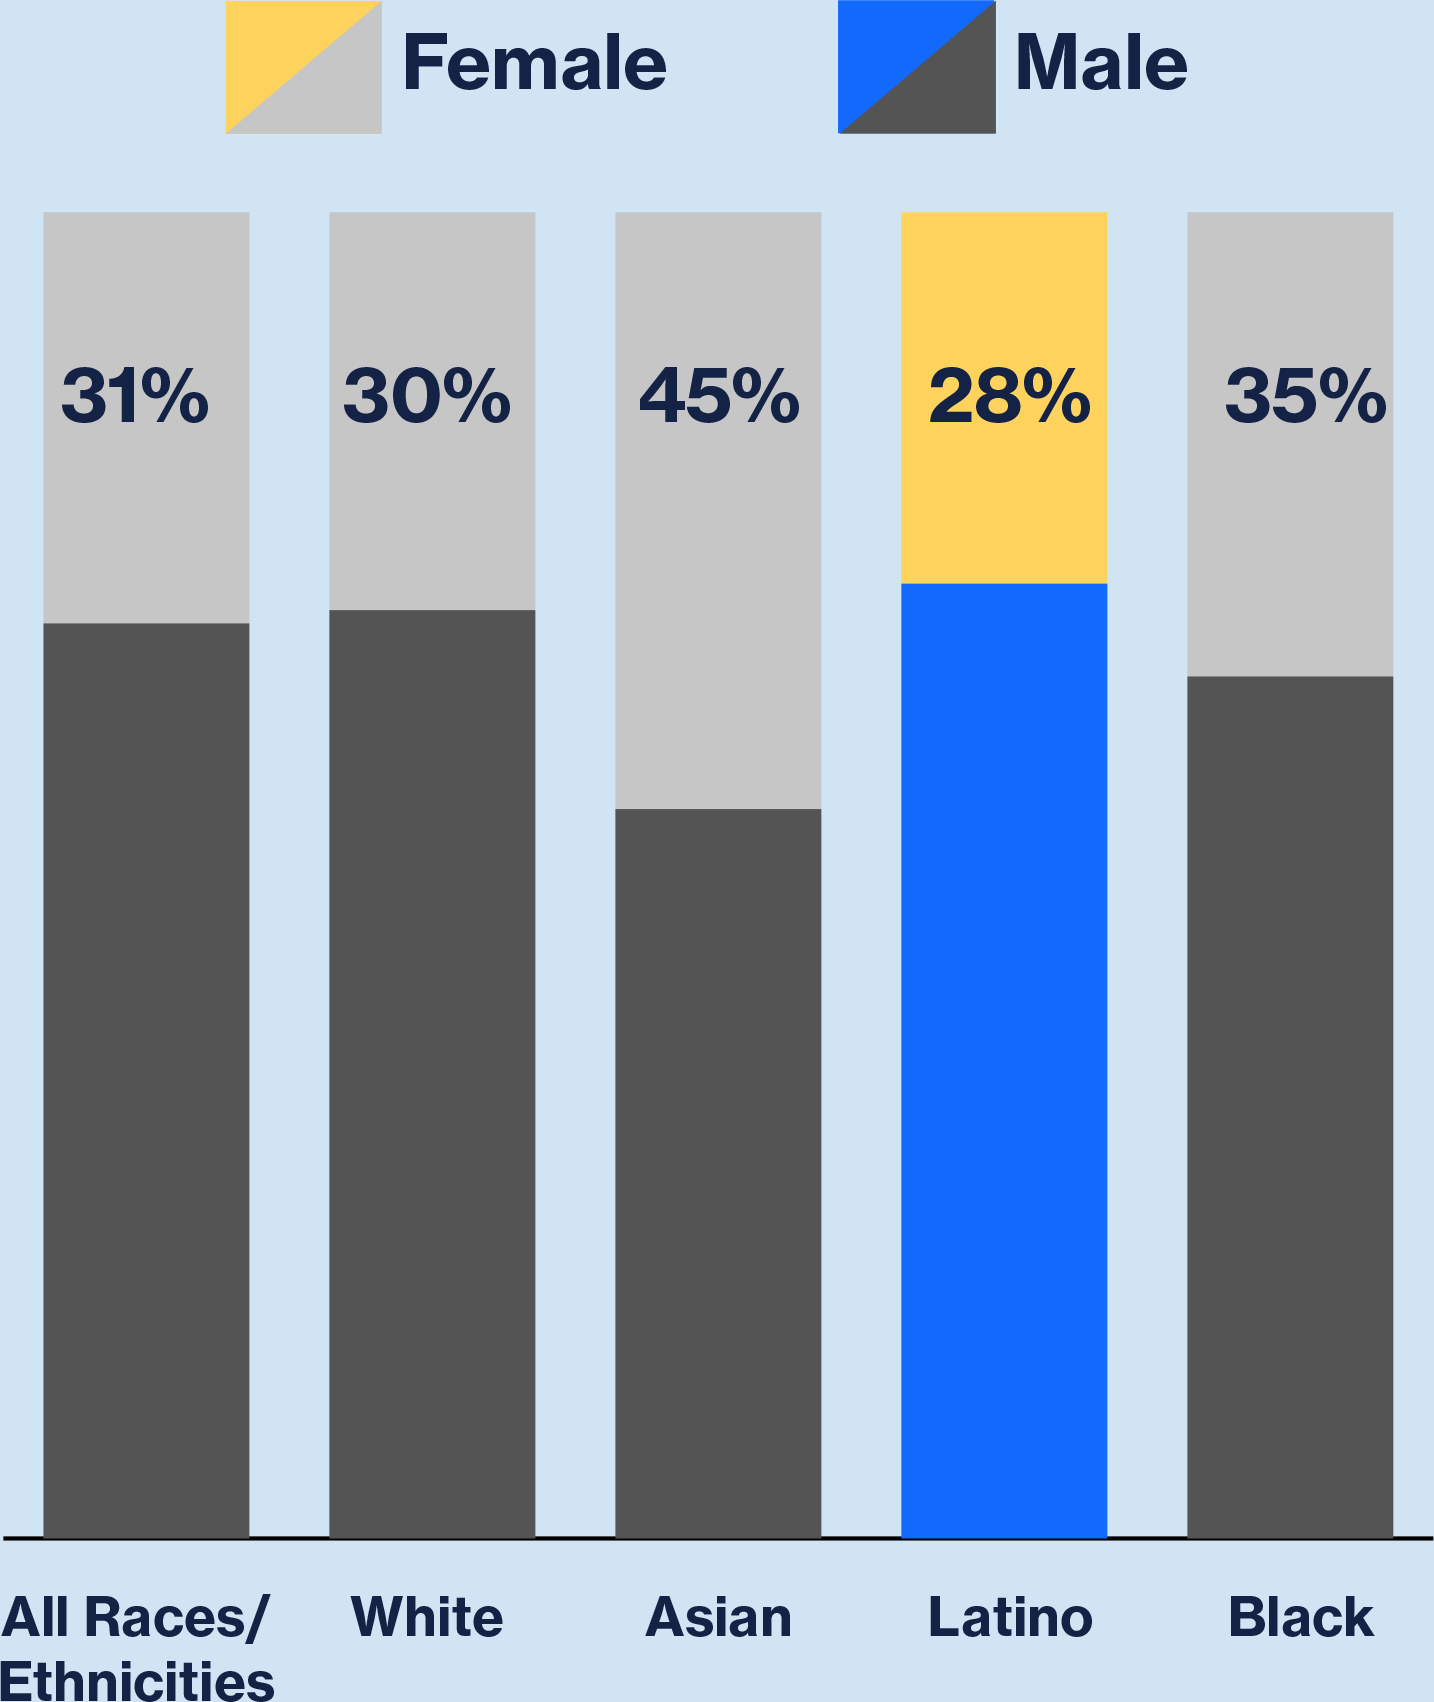
Gender Breakdown of Worldwide Latino Members Compared to All Members
Percent of Worldwide Latino CAS Members in Leadership Roles
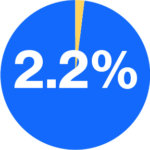 |
Volunteers in the latest year compared to 2.2% last year (2021) |
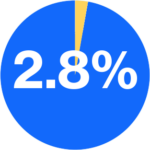 |
Conference Presenters in latest three years (2019-2021) compared to 2.5% last year (2021) |
 |
Committee Chairs in latest three years (2019-2021) compared to 4.7% last year (2021) |
 |
Executive Council/Board in latest five years (2017-2021) compared to 5.0% last year (2021) |
GET INVOLVED
|
SUPPORT THE ORGANIZATION OF |
JOIN THE DIVERSITY IMPACT GROUP TO VOLUNTEER AND SHARE YOUR IDEAS |
If you want to make sure that your demographic information is included in these metrics, please log on to the CAS website and update your membership profile.