


When inflation hits, management wants to know: How much inflation is baked into reserves; and how much could future inflation cost us? Actuaries across the decades respond.
Sir Issac Newton once said that he saw further because he stood on the shoulders of giants.[1]
Here is an actuaries-on-shoulders story with professionals across three decades addressing a topic that again has the profession’s attention: inflation.
Whenever inflation arises, actuaries hear two questions:
- How much inflation is baked into current reserves?
- How much will future inflation increase reserves?
William F. Richards sought answers in the late 1970s, when inflation regularly topped 6% a year. The result: “Evaluating the Impact of Inflation on Loss Reserves,” published as a discussion paper in 1981.
His approach was simple:
- Create a payout pattern of each accident year’s losses. (“Squaring the triangle”)
- Discount those losses back to present value.
- Project the losses back to their future values at the projected inflation rate.
Richards works an example with a hypothetical book of auto bodily injury losses. He discounts reserves, then inflates them by between 5% and 15% annually. He is left with a table of reserve values at various inflation rates. He compares the actual reserve to the values in that table and determines the current reserves have baked-in inflation between 7% and 8%. And the values in the table show how future inflation will change those reserves.
One nice result: The method develops a single inflation rate across all years in the portfolio. That is easier to explain to management than a table of numbers that might vary considerably from year to year.
Two devils lie in the details, though:
Devil No. 1: How do you create an inflation index appropriate for an insurance portfolio?
Devil No. 2: Over what period does inflation act on a claim? Workers’ compensation shows some of the possibilities:[2]
Here is an actuaries-on-shoulders story with professionals across three decades addressing a topic that again has the profession’s attention: inflation.
- A death benefit. In most U.S. states, the heirs of a worker killed on the job receive a fixed death benefit, set by law. Inflation has no direct effect on the benefit. It only rises if lawmakers or regulators decide it should.
- An indemnity claim. Compensation depends on the worker’s weekly wage, which rises with inflation until the date the worker is injured. Inflation affects the benefit until the accident date.
- A medical claim. Payment depends on what is charged for treatment. Inflation affects the benefit until payment date.
In theory, the author’s model should handle each type of claim differently. The medical claims should be handled as Richards does. The death benefits should remain untouched. The indemnity claims should be handled in some manner in between.
Richards acknowledges both issues. For Devil No. 1 (an inflation index), he suggests figuring out the share of loss costs attributable to factors such as medical costs, legal fees, wages and so on. Then finding an inflation index that tracks each factor. Weight the indexes appropriately, and you have an index that lets you credibly discount the reserves.
Richards uses an index for auto bodily injury claims that is 60% from the Consumer Price Index for medical care and 40% from the CPI for hourly earnings of private non-farm production workers.
As far as I could tell, Richards was silent on how to address Devil No. 2 (does inflation affect claims through accident date, closed date or in between). His work can be remembered as the shoulders that actuaries Richard G. Woll, Michelle Morrow and Timothy Conrad stood upon.
Woll was a contemporary of Richards. Morrow and Conrad arrived nearly three decades later, when inflation seemed ready to surge.
Woll’s commentary accompanied Richards’ piece. He noticed different types of claims settle at different rates. Using the workers’ compensation example, in any given accident year, the medical bills will likely be paid first; indemnity settlements will follow. A proper index would need more weight on a medical index early and more weight on indemnity payments late.
That means to properly deflate losses, every accident year within a calendar year would need its own weighting. For a given calendar year, Accident Year X would weight medical and indemnity claims at certain percentages. Accident Year X+1 would weight them differently.
Iterate through all the calendar years, and you end up with an Accident Year by Calendar Year matrix. Woll created such a matrix from actual workers’ compensation data.
But on Devil No. 2 – does inflation affect claims through accident date, closed date or in between – Woll kicks the can. He suggests populating another Accident Year-Calendar Year matrix “judgmentally or through research.” How to judge or what to research is left to the reader.
CAS Fellows Michelle Morrow and Timothy Conrad attacked the matter in “Practical Considerations in Assessing the Impact of Inflation on Carried Reserves.” It was published in the CAS Forum in 2010.
Inflation then was certainly lower than today, but there were real inflation fears. In 2009, federal officials pumped money into the economy in response to the beginning of the Great Recession.
Woll’s commentary accompanied Richards’ piece. He noticed different types of claims settle at different rates.
Fear of inflation ran high. Economist Arthur Laffer wrote in the Wall Street Journal: “We can expect rapidly rising prices and much, much higher interest rates over the next four or five years, and a concomitant deleterious impact on output and employment not unlike the late 1970s.”[3]
That didn’t happen, of course, but insurance management, like executives everywhere, worried it might. The two questions – how much inflation is baked into our reserves, and how would rising inflation grow them – returned. That explains the timing of the Morrow-Conrad paper, in which they slew Devil No. 2.
They found that claim severity organized by the year a claim closed correlated most highly with a host of inflation indices.
They demonstrated empirically that inflation affected claims as long as they were open. Actuaries didn’t have to worry that inflation might not affect certain claims or that inflation only affected a claim till the day it occurred. You could model all claims as if inflation operated on them continuously until the day they were closed.
They found that claim severity organized by the year a claim closed correlated most highly with a host of inflation indices.[4] It was a better predictor than claims organized by Accident Year or Report Year.
For almost every line of business they studied, inflation appeared to affect claims from the moment they opened to the moment they closed.[5] They suggest claims less affected by inflation might settle quickly, so they constitute a small share of year-end reserves. In any event, “this concern [Devil No. 2] was laid to rest as regards our data.”
They had less luck with Devil No. 1. They struggled to find indices that did a good job of tracking the severity trends for a line of business. The failure that distressed them most: auto liability.
Their suggestion: Deflate the triangles “using a selection of indices with good ‘fits’ and evaluate the range of expected reserves needed under different inflation assumptions.” They show the result: a table of 19 columns (one for each inflation index) and 50 rows (five future inflation scenarios for 10 lines of business). That is a 950-cell table.
The table reflects uncertainty in the estimate, but it’s a bit busy. In my career, I found management gained little from a report so rich in fine-print data. This is particularly true because the best-fitting indices – various permutations of the Consumer Price Index – don’t change the results much. Borrowing from Morrow and Conrad’s calculations, 10% inflation will blow up commercial property reserves by 12% if you use CPI-Housing index to deflate those reserves. If you use the CPI-All Items Less Food, that percentage only changes to … 15%.
When I modeled inflation, I focused on management’s second inflation question: the future. I estimated how much a change in the inflation rate would force reserves.
For example, a 2015 presentation I gave at the Southwest Actuarial Forum projected that a two percentage point rise in inflation/loss trend would increase industry reserves by $41.7 billion – or 7.2% of stated reserves.[6]
I also allocated the losses by line of business. Workers’ compensation was most vulnerable, homeowners least.
My answer wasn’t the most sophisticated. But it made an important point: Insurers can’t neglect rising loss trends.
Not all managers will accept my offer of just one answer. To deal with those, actuaries should find firm footing on the shoulders of Richards, Woll, Morrow and Conrad.
Jim Lynch, FCAS, MAAA, is retired from his position as chief actuary at Triple-I and has his own consulting firm.
[1] Wikipedia tells me Newton’s famous statement itself stood on the shoulders of Bernard of Chartres, a 12th Century philosopher. So noted.
[2] Robert Butsic grappled with this topic in a paper I discussed in an earlier Actuarial Review.
[3] Arthur B. Laffer, “Get Ready for Inflation and Higher Interest Rates — WSJ,” Wall Street Journal, June 11, 2009.
[4] Morrow and Conrad focused on claim severity, rather than overall losses. Their research found that frequency confounded the analysis.
[5] The exception was auto physical damage.
[6] Jim Lynch, “Inflation from All Angles,” presentation to Southwest Actuarial Forum, San Antonio, TX, December 4, 2015.
Auto Bodily Injury Losses
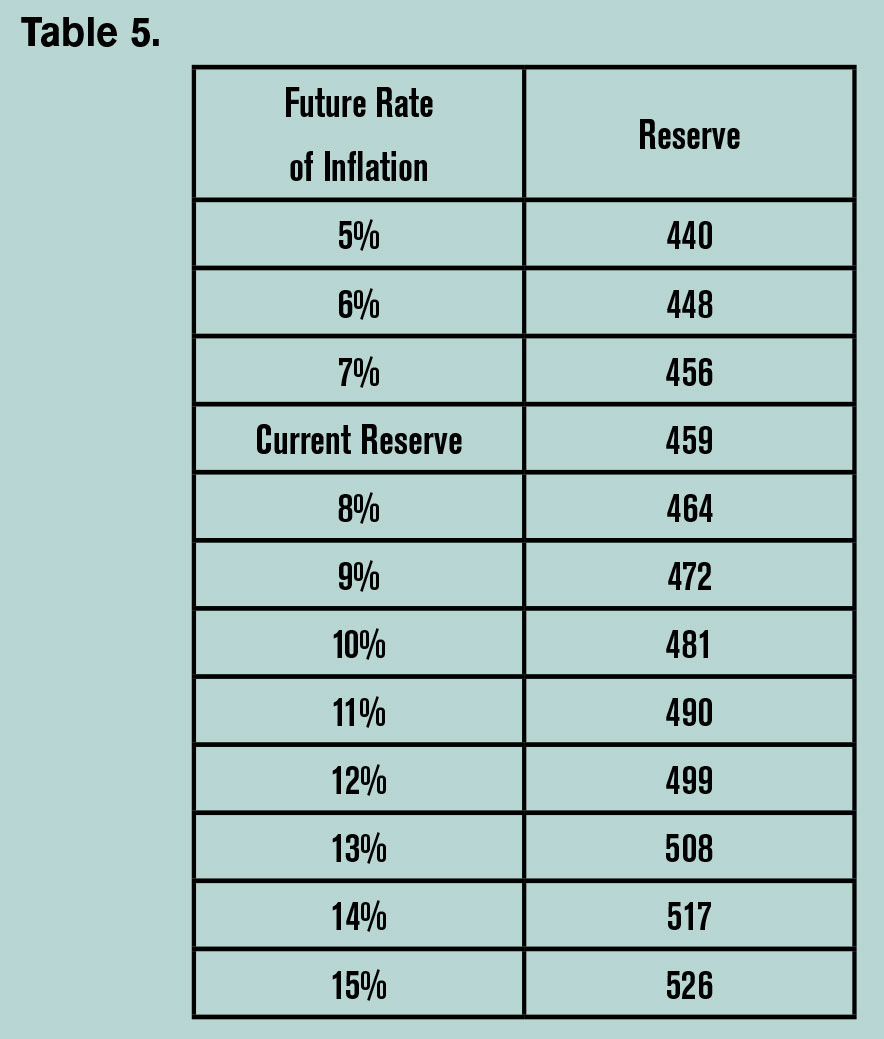
In his paper, “Evaluating the Impact of Inflation on Loss Reserves,” author William F. Richards looks at auto bodily injury losses from accident year 1972 to 1979 as of the end of 1979 (See Table 1). He projects losses through 1986. Some simple math shows the total reserve is 459.
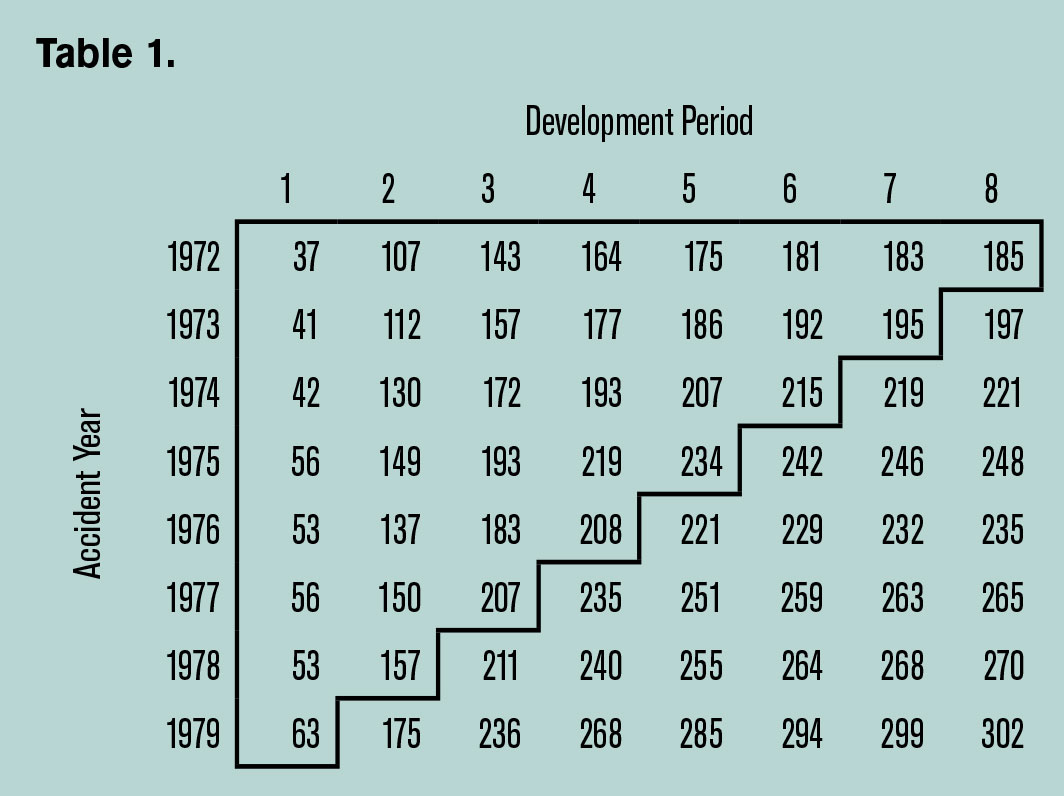
He expresses all payments in 1972 dollars by discounting with this table. Data through 1979 come from a weighted index: 60% Consumer Price Index for medical care and 40% Index of hourly earnings of production workers — Total Private Non-farm (See Table 2).
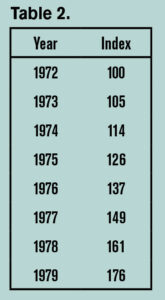
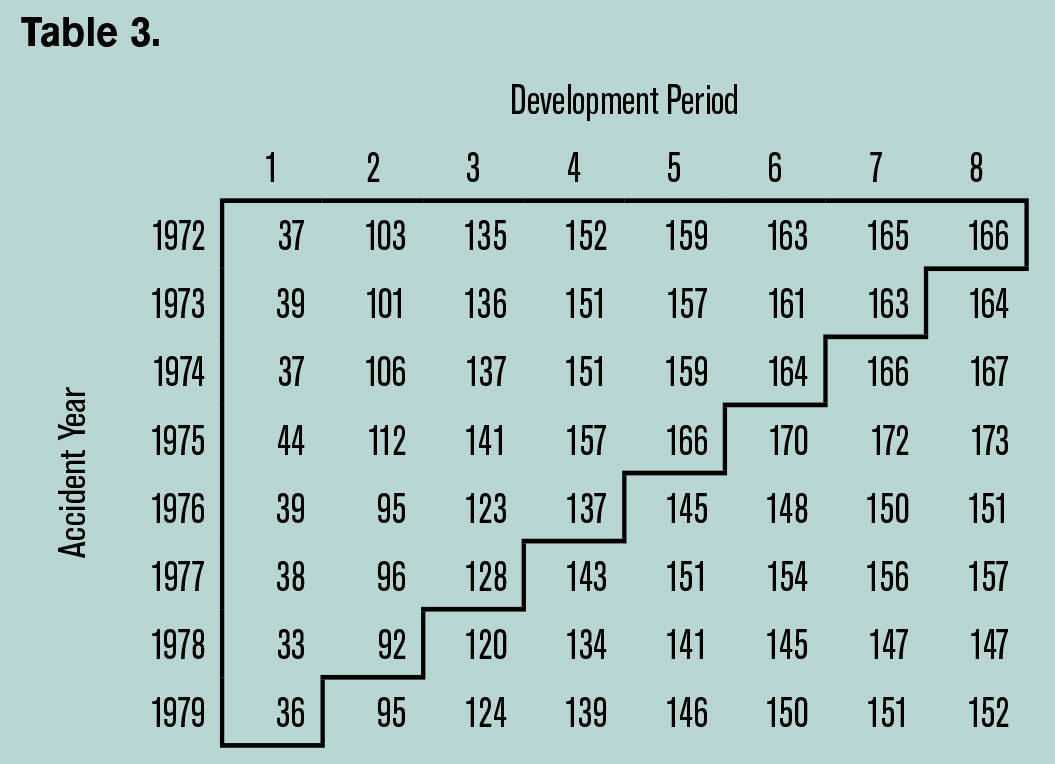
Table 3 contains the discounted values.
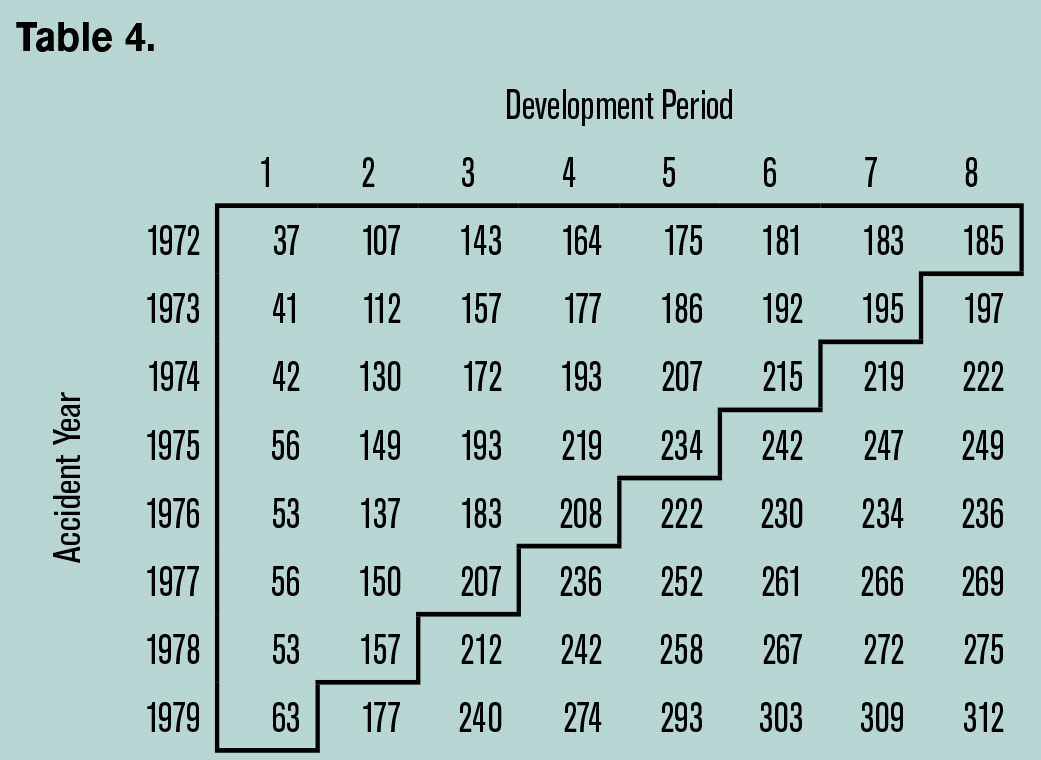
In his final step, Richards inflates projected values by 10 percent annually. He states the projections along with the actual losses from the original triangle. Under this scenario, the total reserve grows to 481 (See Table 4).
His ultimate exhibit shows the actual reserve in a simple table of inflation scenarios (See Table 5). Current reserves have inflation of 7% to 8% baked in. Changes in the inflation rate would change the reserve as indicated.
1 All amounts are in millions of dollars.